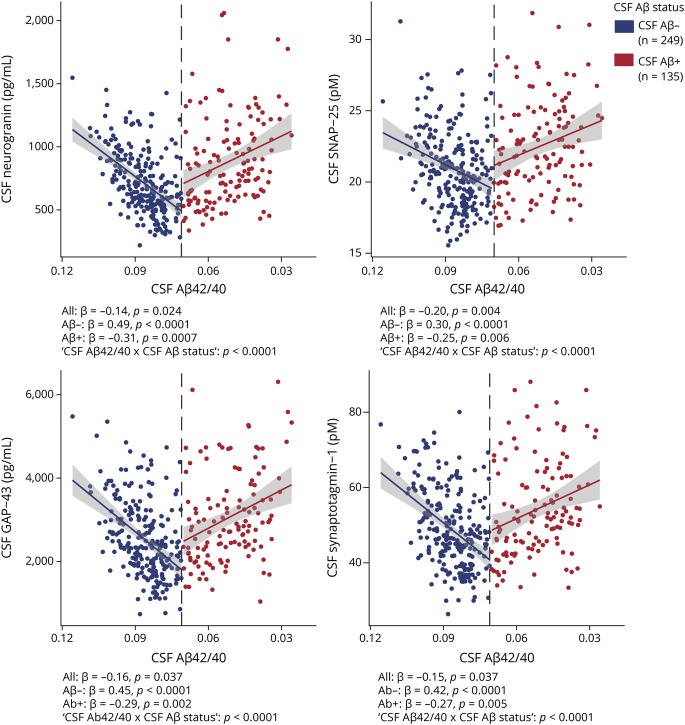
Figure 2. Association of CSF Synaptic Biomarkers With CSF Aβ Pathology.
Scatterplots representing the association of each CSF synaptic biomarker with CSF β-amyloid (Aβ)42/40 in the CSF Aβ-negative (A−; blue) and Aβ-positive (A+; red) groups. Each point depicts the value of the CSF biomarker of an individual, and the solid lines indicate the regression line for each of the groups. The x-axis is reversed. The vertical dashed line indicates the cutoff for CSF Aβ42/40 positivity of 0.071. The standardized regression coefficients (β) and the p values for the total and stratified analyses are shown and were computed with a linear model adjusting for age and sex. In addition, the CSF Aβ42/40 × CSF Aβ status interaction term was computed. All p values are corrected for multiple comparisons with the false discovery rate approach. GAP-43 = growth-associated protein-43; SNAP-25 = synaptosomal-associated protein-25.

