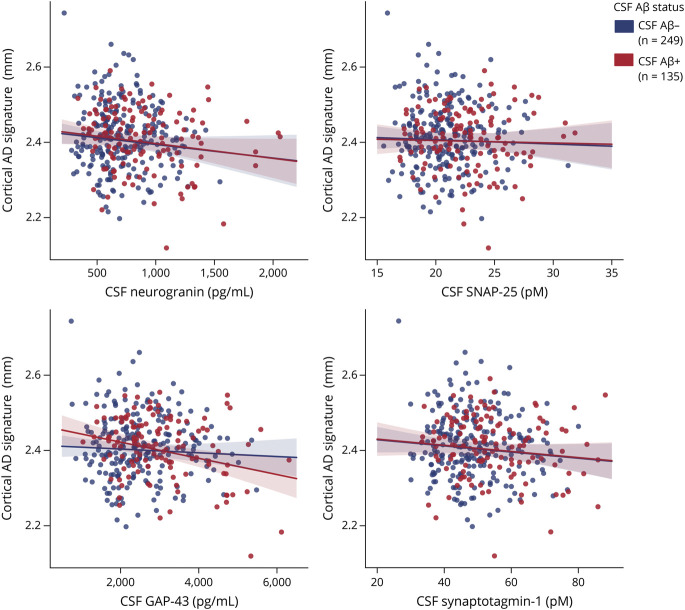
Figure 5. Association of CSF Synaptic Biomarkers With Cortical MRI AD Signature.
Scatter plots representing the association of each of the CSF synaptic biomarker with the cortical thickness (millimeters) Alzheimer disease (AD) signature in the CSF β-amyloid (Aβ)–negative (A−; blue) and the CSF Aβ-positive (A+; red) groups. CSF Aβ status was defined by the CSF Aβ42/40 ratio, and participants were classified as CSF Aβ-positive if CSF Aβ42/40 <0.071. Each point depicts the value of the CSF biomarker of an individual, and the solid lines indicate the regression line for each of the groups. The associations were computed with a linear model adjusted for age and sex. GAP-43 = growth-associated protein-43; SNAP-25 = synaptosomal-associated protein-25.

