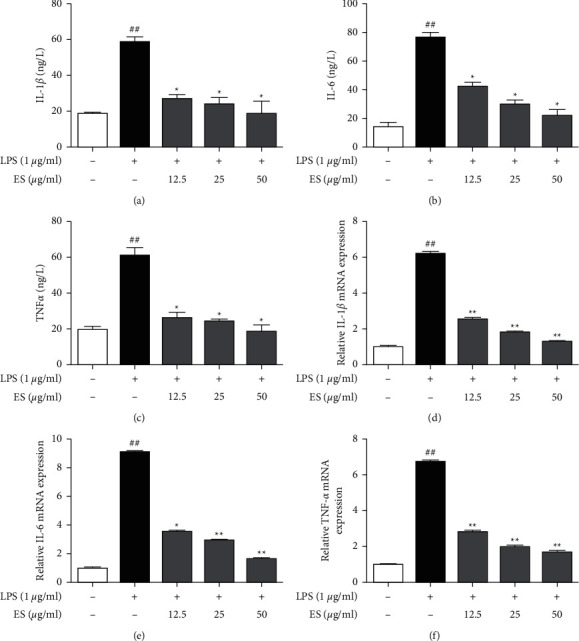
Figure 7.

Effect of ES on proinflammatory cytokine production and gene expression in LPS-induced THP-1 cells. Cells were treated with LPS (1 μg/mL) and ES (12.5, 25, 50 μg/mL) for 12 h. The IL-1β, IL-6, and TNF-α contents were measured using ELISA kits (a–c). The mRNA expression levels of IL-1β, IL-6, and TNF-α were determined by qRT-PCR and normalized to the β-actin levels (d–f). Data are presented as means ± SD (n = 3). ##P < 0.01 versus the blank control group. ∗P < 0.05 and ∗∗P < 0.01 versus the LPS-treated group.
