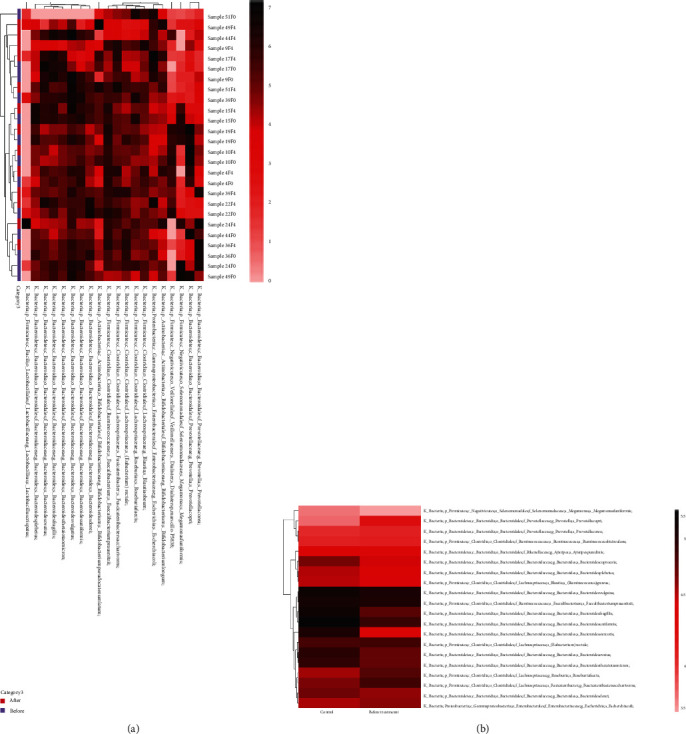
Figure 2.

Heat map of common species in (a) all samples or (b) control and before treatment group. Darker colors represent higher abundance. The degree of similarity between samples and between microbiota is indicated by the dendrogram on the x- and y-axis, respectively.
