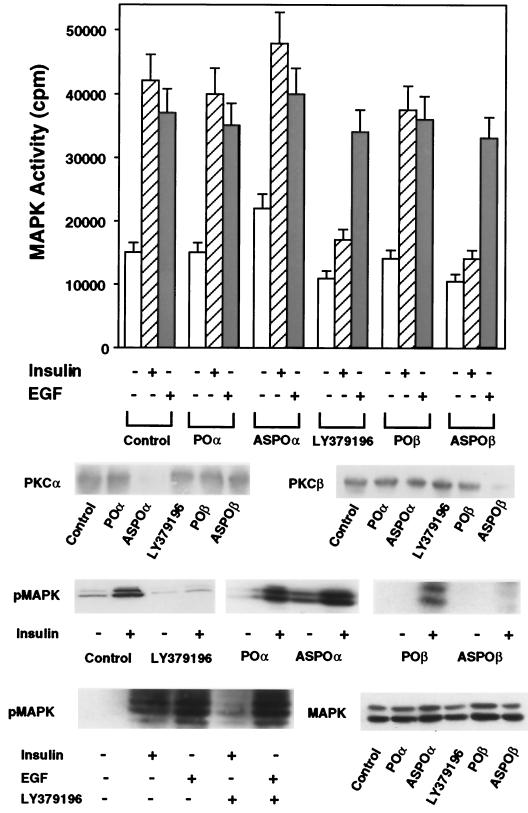
FIG. 7.
MAPK phosphorylation and activity in L6 cells upon blocking PKCα and -β. (Top) Antisense oligonucleotide and pharmacological blocking of PKCα or PKCβ in L6hIR2 cells was achieved as described in the legend to Fig. 5. The cells were then exposed to 100 nM insulin or EGF as indicated, solubilized, and precipitated with MAPK antibodies. MAPK activity was assayed in the immunoprecipitates as described in the legend to Fig. 4. Bars represent the means ± standard deviations of duplicate determinations in four independent experiments. For control (middle), lysates (300 μg of protein/assay) were subjected to SDS-PAGE and Western blotted with PKCα or PKCβ antibodies as indicated. Alternatively (bottom), proteins in the lysates were blotted with phosphorylated MAPK (pMAPK) or MAPK antibodies. The autoradiographs shown are representative of three (PKCα and PKCβ) or five (pMAPK and MAPK) independent Western blot determinations.

