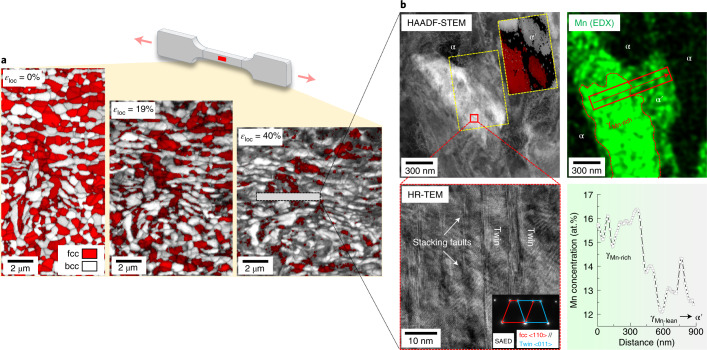
Fig. 3. Microstructure evolution of the HET sample under the H-free condition.
a, The schematic illustrates the tensile specimen subjected to deformation and ex-situ EBSD probing, with the red spot showing where the EBSD images were taken. Ex-situ electron backscatter diffraction observation up to a local tensile strain (εloc) of 40%, showing the partial austenite-to-martensite transformation. b, STEM and EDX analyses generated roughly from the subsurface of the rectangular frame marked in a. The inset in the HAADF-STEM image is a transmission Kikuchi diffraction phase plus IQ map, taken from the yellow rectangular frame. The EDX line profile is taken from the area marked by an arrow in the EDX map. The inset in the HR-TEM image shows the selected area electron diffraction (SAED) of the twinned structure, with diffraction spots for the fcc matrix and the fcc twin, marked by two quadrilaterals in different colours.

