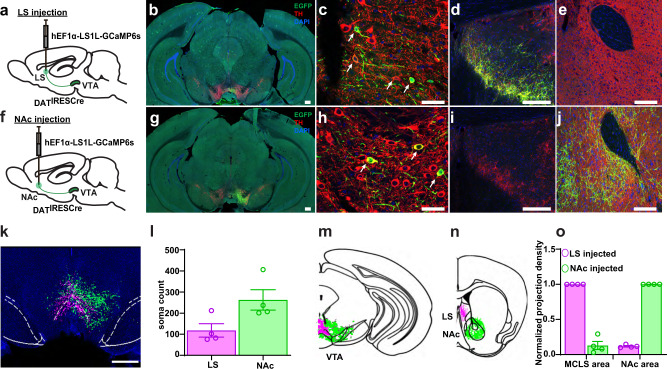
Fig. 2. Retrograde labeling of DAergic VTA→LS and VTA→NAc projection neurons.
a, f Schematic diagram of retrograde hEF1α-LS1L-GCaMP6s injections into the LS and NAc of DATIRESCre mice. b–e, g–k Confocal images from hEF1α-LS1L-GCaMP6s injected DATIRESCre mice anti-GFP (green), anti-TH (red), and DAPI, (blue). b, g Whole section images containing the VTA. c, h Zoomed in confocal images of retrogradely labeled neurons in the VTA, arrows indicate double labeled cells. d Colocalization of GFP positive and TH positive fibers at the LS injection site. e Absence of GFP positive fibers in the NAc of LS injected mice. i Absence of GFP positive fibers in the LS of NAc injected mice. j Colocalization of GFP positive and TH positive fibers at the NAc injection site. k 2D reconstruction of the aggregate retrogradely labeled VTA-to-LS neurons (magenta) and VTA-to-NAc neurons (green) from four mice injected into the LS and four mice injected into the NAc. Soma locations were superimposed on one DAPI coronal image and overlaid with the outlines (white dashed lines) of the VTA brain areas from the Allen Mouse Brain Atlas. l VTA soma counts for LS and NAc injected animals. m, n Schematic of VTA-to-LS and VTA-to-NAc projection pathways. Aggregate of segmented somas (m) and terminals (n) for VTA→LS neurons (magenta) and VTA→NAc neurons (green). Coronal cartoon prepared based on Allen Brain Atlas. o Axonal projection density for LS and NAc injected brains, normalized by density at injection site. Scale bars: 300 μm (b, g), 200 μm (d, e, i, j), 50 μm (c, h), 1 mm (k). Quantification presented in mean ± SEM; n = 4 in each group.

