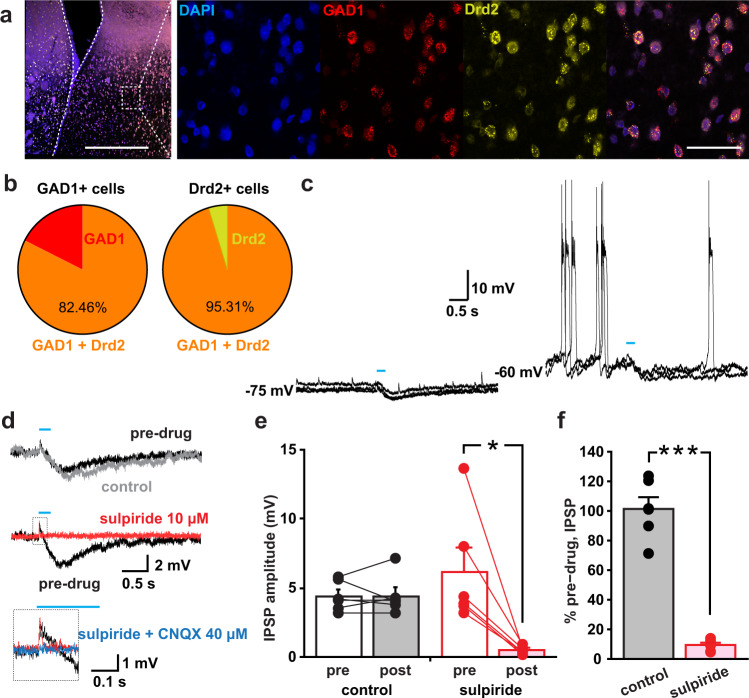
Fig. 5. DA acts to hyperpolarize LS projection neurons via D2 receptor activation.
a Representative RNAscope image displaying colocalization of GAD1 (red) and Drd2 (yellow) mRNA in the LS; scale bars (500 and 50 µm). b The pie diagrams show high GAD1 & Drd2 colocalization in the LS; 82.46% of GAD1 positive neurons were also positive for Drd2 and 95.31% of Drd2 positive neurons were also positive for GAD1. c Sample traces of IPSPs without current injection (at −75 mV, left) and with the current injection to make the neuron fire (at −60 mV, right). Three traces are superimposed. Blue lines indicate the timing of train photo-stimulation (five pulses at 20 Hz). d Sample traces of IPSPs without depolarizing current injection before drug application (pre-drug), after 5 min application of control solution without drugs (control), and after 5 min application of sulpiride. The small EPSP in the dashed square of the middle panel is expanded below. The expansion shows a trace after application of sulpiride and CNQX. Each trace is an average from three consecutive traces. e IPSP amplitudes from each cell (circles) and means, for control recording and sulpiride application, during pre-drug period (pre) and 5 min after application (post). Lines connect data from the same recorded cells. f Percent pre-drug amplitude after application of control solution (gray bar) or sulpiride (pink bar). e, f n of recorded cells = 6 in each condition, n of recorded animals in e and f = 8 animals (six each for control and sulpiride; four pairs were from the same animals).

