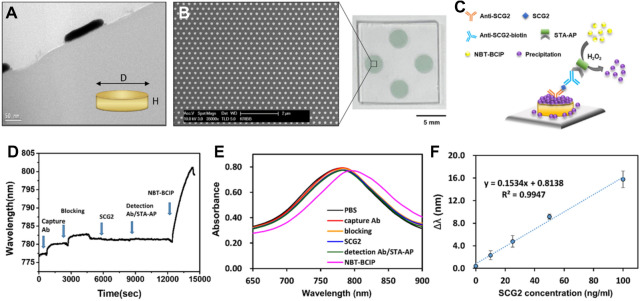
Figure 1.
Nanoplasmonic immunosensor for detection of serum SCG2. (A) Transmission electron microscope (TEM) image of a gold nanodot. D (diameter): 150 nm, H (height) 20 nm. (B) Scanning electron microscope (SEM) image of gold nanodot array (GNA) uniformly fabricated on a glass substrate. The GNA chip has a size of 13 mm × 13 mm. The size of the circle sensing region inside the chip is 3 mm in diameter. (C) A schematic representation of the nanoplasmonic immunosensor using enzyme catalytic precipitation reaction. STA-AP, streptavidin–alkaline phosphatase-conjugate. The real-time sensorgram (D) and LSPR spectral changes (E) of each step in the immunoassay for SCG2 (100 ng/mL). (F) Standard curve was prepared by plotting the ∆λ measured with varying concentration of SCG2 (from 0 to 100 ng/mL). The regression equation was y = 0.1534x + 0.8138 (R2 = 0.9947) in the linear range. Each data point is the average of N = 3 individual measurements, and the error bars indicate standard deviation.

