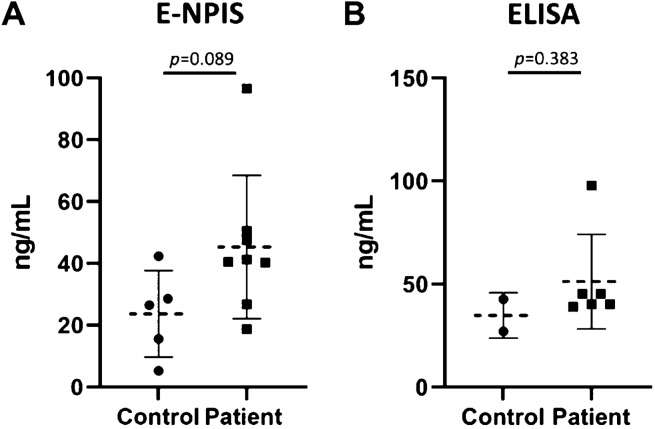
Figure 3.
Analysis of SCG2 concentration in clinical serum samples. SCG2 concentration in serum samples of patients and control groups was analyzed with enhanced nanoplasmonic immunosensor (E-NPIS) (A) and ELISA (B). The serum samples were 1:10 diluted (E-NPIS) or 1:5 diluted (ELISA) with PBS buffer. Data represent the means ± s.d. of three replicates from 5 controls and 8 patients for E-NPIS analysis, 2 controls and 6 patients for ELISA analysis. SCG2 concentration was below the LOD of ELISA for some clinical samples. P = 0.089 for E-NPIS and p = 0.383 for ELISA (Student’s t-test). Basic information of clinical serum samples was described in Table S1 (Supplementary information).

