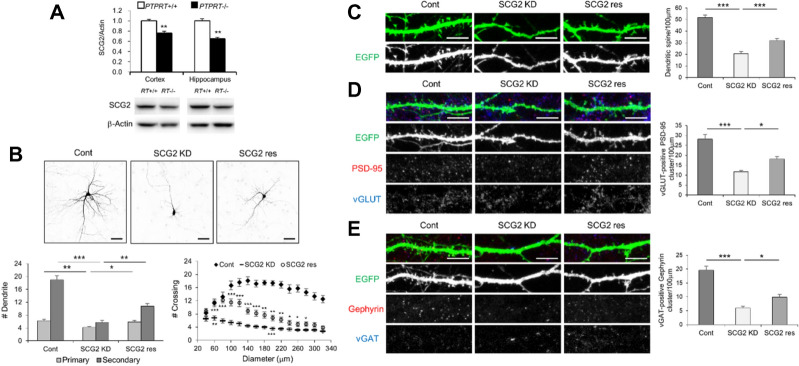
Figure 5.
Dendritic arborization and synaptic formation attenuated by SCG2 knockdown. (A) Decreased SCG2 in the brain tissues of PTPRT−/− null mice. SCG2 expression was examined in the cortical and hippocampal tissues of PTPRT−/− null mice. Western blotting displayed that SCG2 levels relative to β-actin decreased in PTPRT-/- null mice as compared with wild-type mice (n = 7, 6). **p < 0.01 (Student’s t-test). The original images are presented in Supplementary Fig. S6. (B) Attenuated dendritic arborization by SCG2 knockdown. Rat hippocampal neurons were transfected with SCG2-shRNA to knock down SCG2 expression (Fig. S7A). The numbers of dendrites and arborization significantly decreased by SCG2 knockdown (SCG2 KD) as compared with the control group (Cont), and were rescued by the addition of Res SCG2 resistant to SCG2-shRNA to this context (SCG2 res) (Fig. S7B). Means s.e.m. of data from 12 control neurons (Cont), 12 SCG2-shRNA neurons (SCG2 KD), and 14 SCG2-shRNA + Res SCG2 neurons (SCG2 res) are shown. By the Turkey post hoc test after application of one-way ANOVA, primary dendrites: *p < 0.05 and **p < 0.01, F = 6.887, p = 0.003; secondary dendrites: **p < 0.01 and ***p < 0.001, F = 45.80, p < 0.0001. Sholl analysis of arborization: *p < 0.05, **p < 0.01, and ***p < 0.001 (Student’s t-test). Scale bar: 50 μm. (C–E) Decreased synaptic formation by SCG2 knockdown. The density of dendritic spines and the numbers of excitatory and inhibitory synapses significantly decreased by SCG2 knockdown (SCG2 KD) as compared with the control group (Cont), and were rescued by the addition of Res SCG2 to this context (SCG2 res). Means s.e.m. of data from 28 dendrites of 7 control neurons (Cont), 26 dendrites of 7 SCG2-shRNA neurons (SCG2 KD), and 26 dendrites of 7 SCG2-shRNA + Res SCG2 neurons (SCG2 res) are shown. By the Turkey post hoc test after application of one-way ANOVA, the density of dendritic spines: ***p < 0.001, F = 66.67, p < 0.0001; the numbers of excitatory synapses: *p < 0.05 and ***p < 0.001, F = 24.67, p < 0.0001; the numbers of inhibitory synapses: *p < 0.05 and ***p < 0.001; F = 37.65, p < 0.0001. Scale bar: 10 μm.

