
Figure 1.
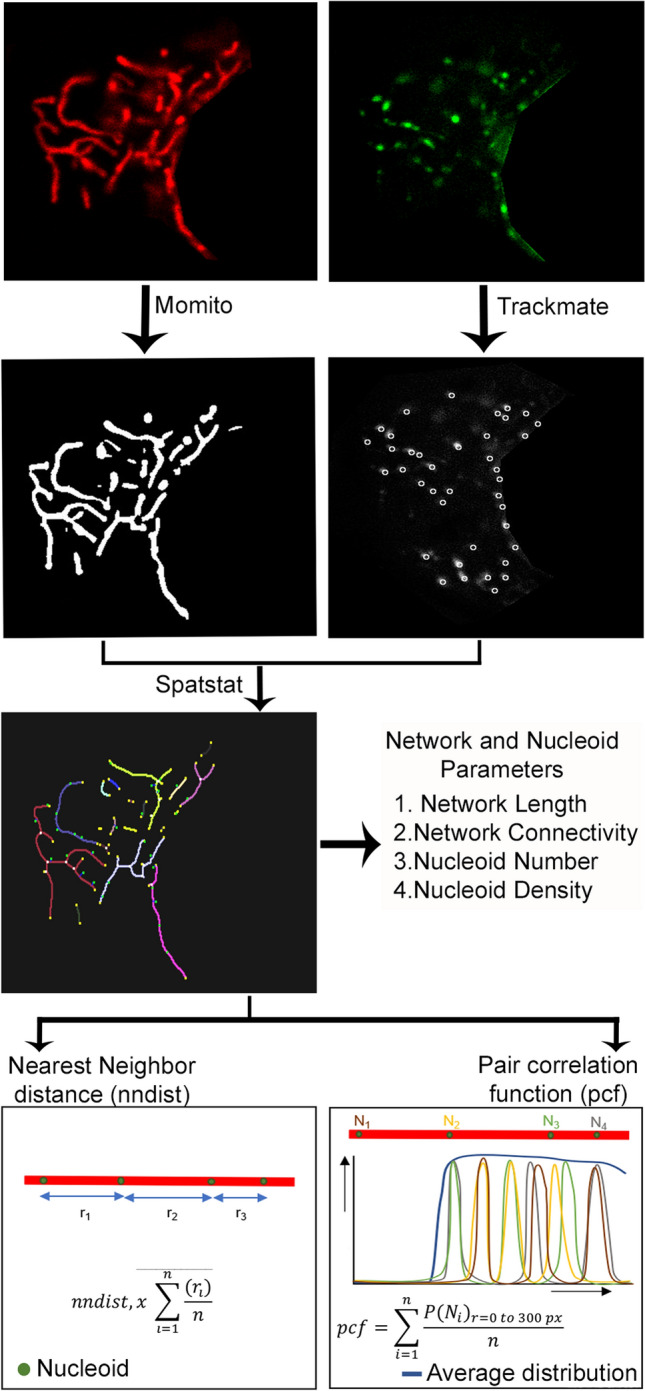
Schematic representation of nucleoid distribution analysis by Mitomate tracker. Confocal live cell Images of mitochondria (TMRM, red) and nucleoids (Picogreen, green—nucleus manually removed) are analyzed using Mitomate tracker. Mitochondria are segmented and their components are identified using Momito while nucleoids are identified using the Image J Plugin Trackmate. The information extracted from Momito and Trackmate is then analyzed by the R package spatstat. Mitomate Tracker provides detailed descriptors of network and nucleoid features and measures nucleoid distribution pattern by two metrics, the nearest neighbor distance (nndist) and the pair correlation function (pcf).