Figure 5.
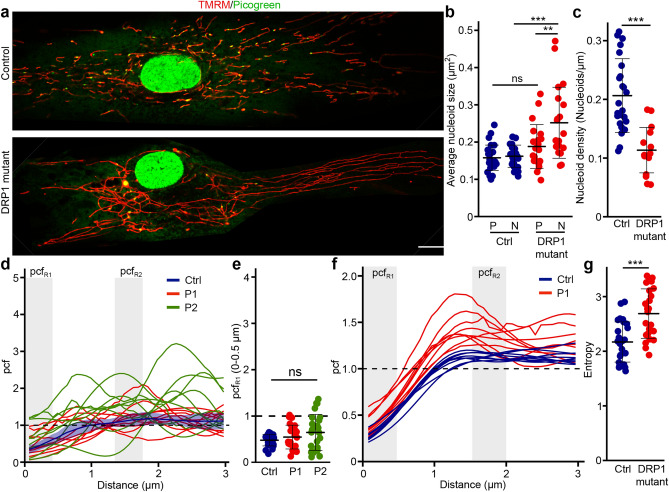
DRP1 is required for proper nucleoid distribution. (a) Representative live cell confocal images of control and DRP1 mutant primary fibroblasts stained with TMRM (mitochondria) and picogreen (DNA) Scale bar, 10 µm. (b) Average nucleoid size in peripheral (P) and perinuclear (N) regions of control and DRP1 mutant primary fibroblasts. Each data point represents one cell. Bars represent the average of 20 cells ± SD. **, p = 0.0047718 (DRP1 mutant P vs N), ***p = 0.0000130 (N Ctrl vs N Mutant), ns not significant. One-way ANOVA. (c) Nucleoid density in control and DRP1 mutant primary fibroblasts. Each data point represents one cell. Bars represent the average of 20 cells ± SD. ***p = 2.164e-06. Two-tailed t-test. (d–f) Nucleoid distribution in control and DRP1 primary human fibroblasts. (d) pcf curves. The solid line for the control (Blue) represents the average distribution and the shaded area, the SD (n = 9 cells). For the DRP1 mutants, each solid line represents one individual cell (n = 9 cells per patient line), highlighting the variability of the pcf. The dashed line represents the expected random distribution and the grey areas, the distance for which the average pcf was quantified (e; pcfR1: 0–0.5 µm). (e) Average pcf values at short distances. Each data point represents one cell. Bars represent the average of 30 cells ± SD. ns not significant. One-way ANOVA. (f) Nucleoid distribution in control and DRP1 primary human fibroblasts stained with TFAM (nucleoids) and TOM20 (mitochondria). Each line represents a distinct cell (n = 9 for control (Blue) and DRP mutants (Red)). The dashed line represents the expected random distribution and the grey areas, pcfR1 (0–0.5 µm) and pcfR2 (1–1.5 µm)). (g) Entropy values calculated from the pcf curves in (d). Each data point represents one cell. Bars represent the average of 30 cells ± SD. ***p = 3.377e-05. Two-tailed t-test.

