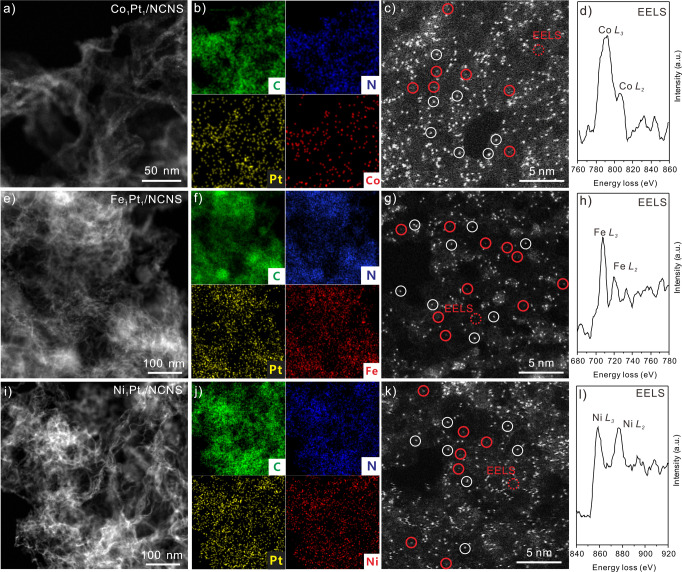
Fig. 3. Morphology of M1Pt1/NCNS catalysts.
HAADF-STEM images of Co1Pt1/NCNS (a), Fe1Pt1/NCNS (e), and Ni1Pt1/NCNS (i) at low resolution and corresponding EDX mapping (b, f, and j). HAADF-STEM images on Co1Pt1/NCNS (c), Fe1Pt1/NCNS (g), and Ni1Pt1/NCNS (k) samples. The white circles highlight the Pt single atoms. The red circles highlight the Co, Fe, and Ni single atoms, respectively. d, h, and l Corresponding EELS spectra at the location of red dash circle in c, g, and k.

