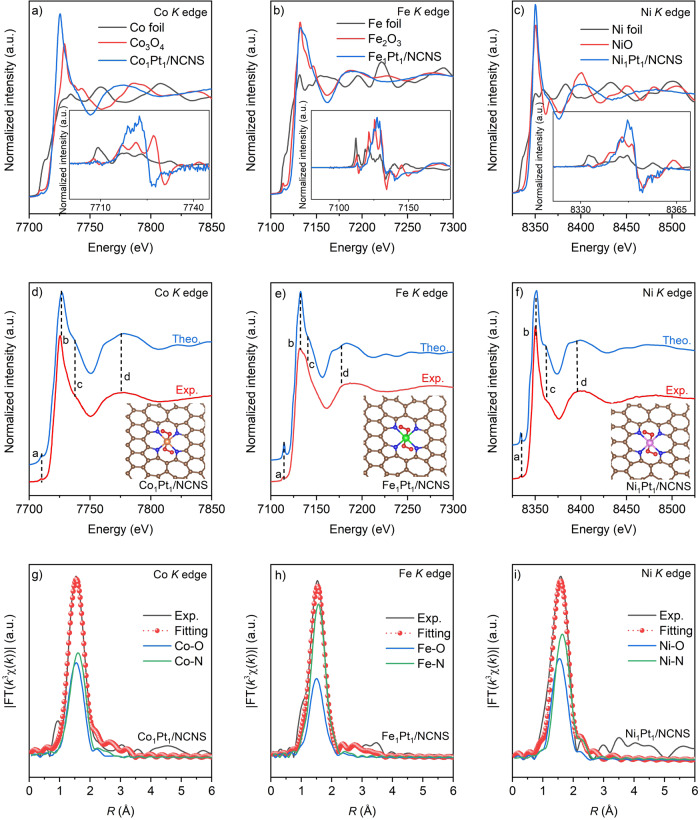
Fig. 4. Identification of the local structure of M1Pt1/NCNS catalysts.
a–c The experimental K-edge XANES spectra and first derivative curves (insets) of M1Pt1/NCNS and references samples. d–f Comparison between the experimental K-edge XANES spectra of M1Pt1/NCNS and the simulated spectra. Some of the main features reproduced are highlighted at points “a” to “d”. Fitting results of the k3-weighted FT spectrum of M1Pt1/NCNS at Co (g), Fe (h), and Ni (i) K edges. The white, brown, blue, red, orange, green, and pink spheres represent H, C, N, O, Co, Fe, and Ni, respectively.

