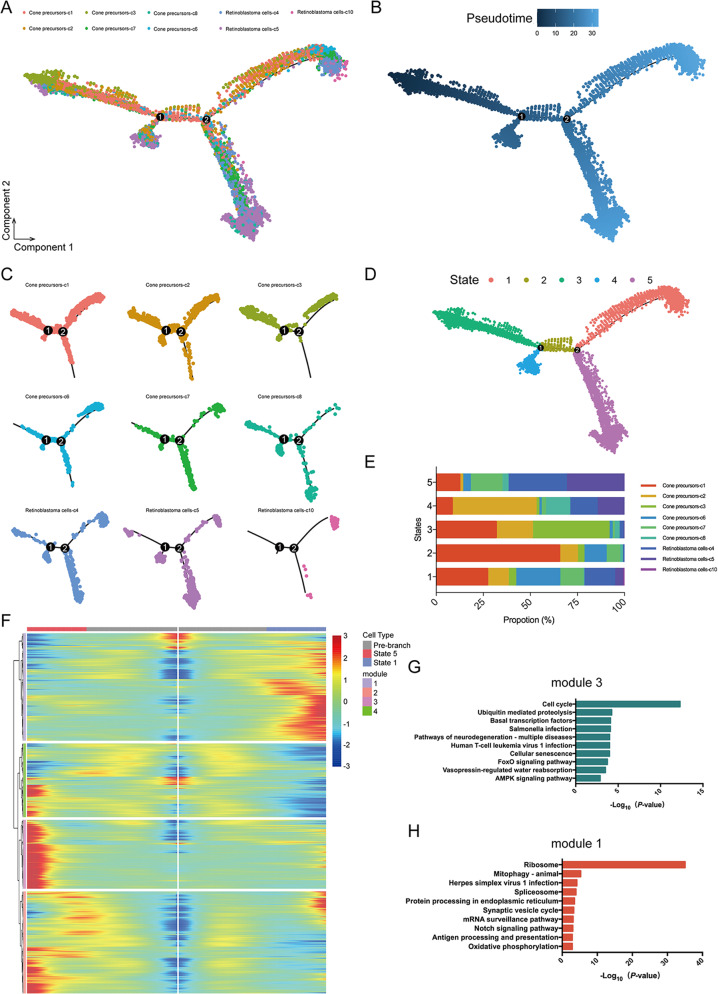
Fig. 2. Construction of cone precursors and retinoblastoma cells differentiation trajectories.
A, B Trajectory analysis revealing the retinoblastoma progression, colour-coded according to cell clusters (all six subtypes of cone precursors and three subtypes of retinoblastoma cells). C Pseudotime trajectory analysis of individual clusters (c1, c2, c3, c4, c5, c6, c7, c8, c10). D The trajectory showed state-specific progression patterns in retinoblastoma. E Composition of the clusters within each cell state. F Heatmap showing the ordering gene expression dynamics during the cellular-state transition process and expression dynamics. State-1 and state-5 reprogramming trajectories (including pre-branch) are shown on the right and left, respectively. G, H Heatmap of KEGG enrichment analysis enrichment by module 3 (G) and module 1 (H).

