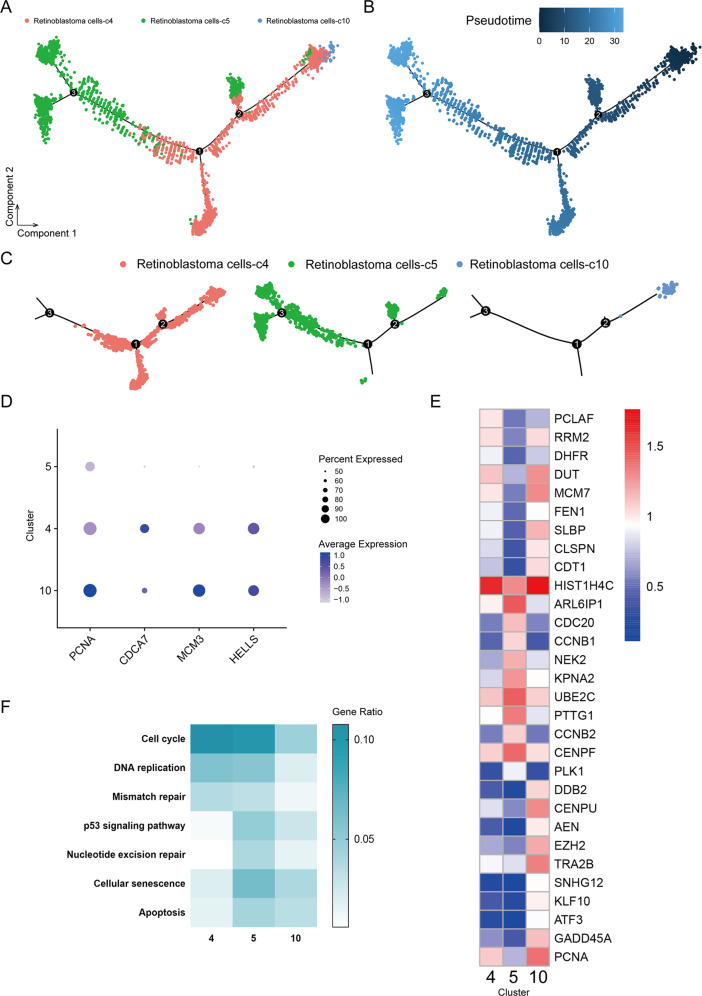
Fig. 4. Trajectory analysis of retinoblastoma cells.
A, B Trajectory analysis revealing the retinoblastoma cells progression, colour-coded according to cell clusters (all three subtypes of retinoblastoma cells). C Pseudotime trajectory analysis of individual clusters (c4, c5, c10). D Feature expression heatmap showing expression patterns of select markers across three retinoblastoma cell clusters. The size of each circle depicts the percentage of cells expressing the marker within the cluster. Purple colour indicated the average expression (number of transcripts). E Heatmap displaying normalized expression of top 10 DEGs among three subtypes of retinoblastoma cells (c4, c5, c10). F Heatmap of KEGG enrichment analysis enrichment by clusters (c4, c5, c10).

