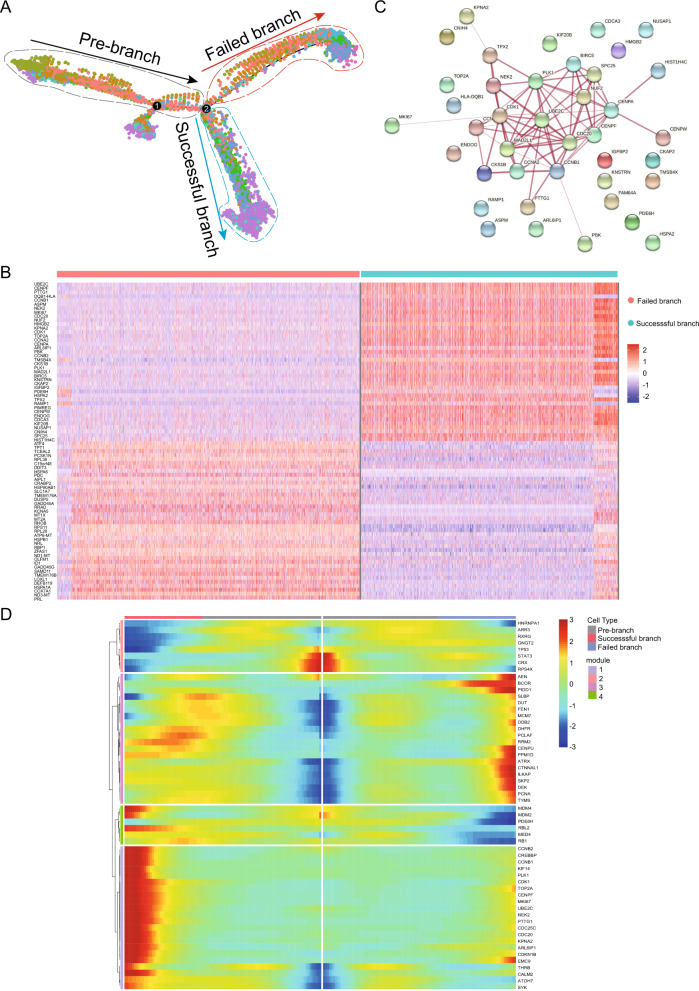
Fig. 5. Reconstruction of Reprogramming Trajectory in a Pseudotime Manner.
A Trajectory reconstruction of all single cells throughout chemical reprogramming reveals three branches: pre-branch (before bifurcation), successful branch, and failed branch (after bifurcation). Blue and red circles indicate cells of the successful and failed branches, respectively. B Heatmap showing the top 40 DEGs expression levels in successful branch and failed branch cells. C Protein-protein interaction network of the top 40 DEGs in successful branch. D Heatmap showing the select genes expression dynamics during the cellular-state transition process and expression dynamics. The successful and failed branches reprogramming trajectories (including pre-branch) are shown on the right and left, respectively.

