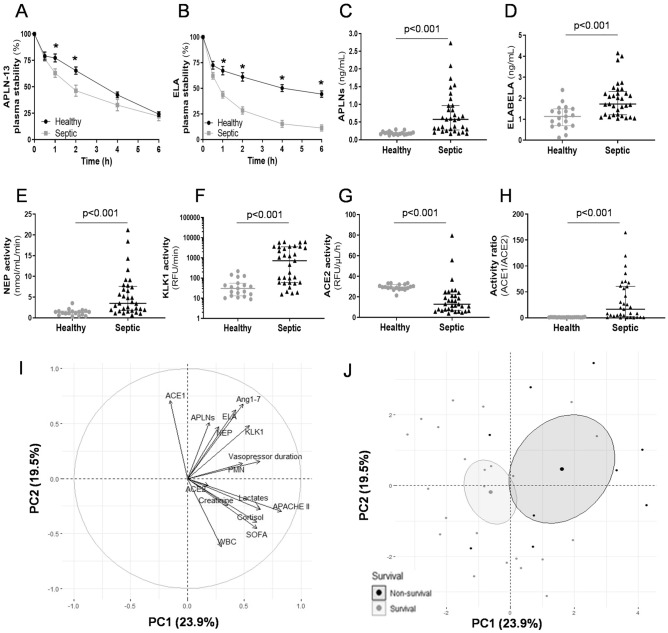
Figure 4.
Acute septic shock dysregulated the apelinergic release-degradation rollover and was associated to the activation of specific enzymatic breakdown activities and worsened outcome impacts. A cohort of 33 patients with acute sepsis/septic shock (Sepsis) was included in the study and compared to 19 age-matched healthy volunteers (Healthy) for: (i) assessment of plasma peptide stability; (ii) apelin (APLN) and Elabela (ELA) plasma level determination; (iii) measurement of specific enzymatic breakdown activities; and iv) analyses of the statistical associations between biological; clinical and outcome data. (A,B) A randomly selected subset of Sepsis (n = 22) and Healthy (n = 10) plasma were assayed for APLN-13 and ELA stability. The results are expressed as the mean ± SEM. After 1 h incubation, APLN-13 -at two time-points- but also ELA – at four time-points- were more degraded by plasma from septic patients (Sepsis)., *p < 0.05 compared with time-matched values. (C,D) Plasma levels of APLNs (all isoforms and moieties) and ELA. Data are displayed as the median [25–75 interquartile range]. Sepsis vs. Healthy induced a higher magnitude of APLN vs. ELA increased levels in bloodstream. (E–G) Plasma activities of neprilysin (NEP), kallikrein (KLK1), and angiotensin-converting enzyme 2 (ACE2). (H) ACE1/ACE2 enzymatic activity ratio (individual data plots display). Sepsis vs. Healthy enhanced NEP; KLK1; and ACE1/ACE2 enzymatic activity ratio (with decreased ACE2 activity). (I) Correlation circle graph of 15 variables related to sepsis outcome from 33 patients and to the apelinergic release-degradation system. Two PCs (PC1 and PC2) were identified in a principal component analysis (PCA), explaining 43% of the variation in the dataset. (J) Individual dispersion graph of PCA split by survival status. The midpoint of the concentration ellipses is representative of the gravity center for each modality of survival. Statistical analyses for quantitative variables were performed with a Mann–Whitney U test (nonnormally distributed variables) for panels (C–H).

