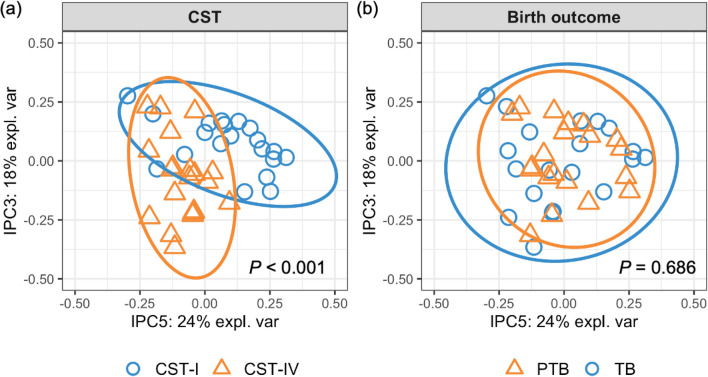
Figure 1.
The cervicovaginal metabolome clusters by community state type (CST). Independent principal component analysis (IPCA) plots of metabolite profiles colored by CST (a) and birth outcome (b). Blue dots indicate CST I samples in (a) and term birth (TB) samples in (b); yellow triangles indicate CST IV samples in (a) and spontaneous preterm birth (sPTB) samples in (b); circles indicate the 95% confidence ellipse of samples. p values of permutational multivariate analysis of variance (PERMANOVA) are shown in each panel. The two components with the largest explained variance of metabolite composition, IPC 5 (24%) and IPC 3 (18%), are shown.

