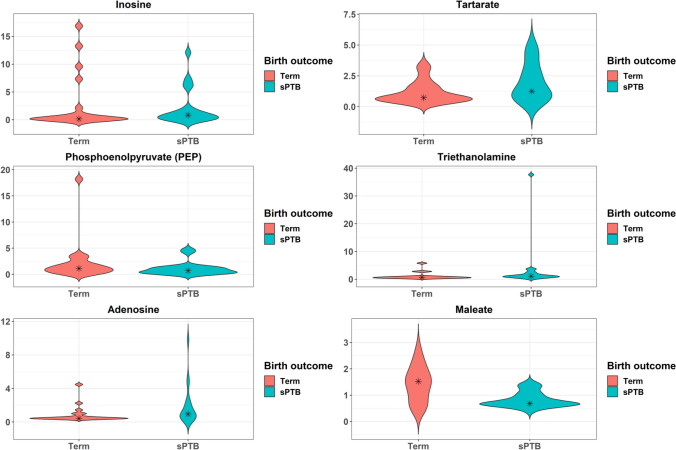
Figure 5.
Violin plots of metabolites among CST I that differed by birth outcome. Kernel probability density of various metabolites are presented. Metabolite abundances were log2 transformed and two-sided Student t-tests were performed. Resulting p-values were corrected by false discovery rates calculated using the Benjamini–Hochberg (BH) method with a threshold of ≤ 0.1. Fold change was calculated to quantify the difference in log2 change between groups for each metabolite. Metabolites with a p-value ≤ 0.05 and absolute fold changes ≥ 1.5 were considered significant. Violin plots are presented for the top six metabolites with the greatest fold change.

