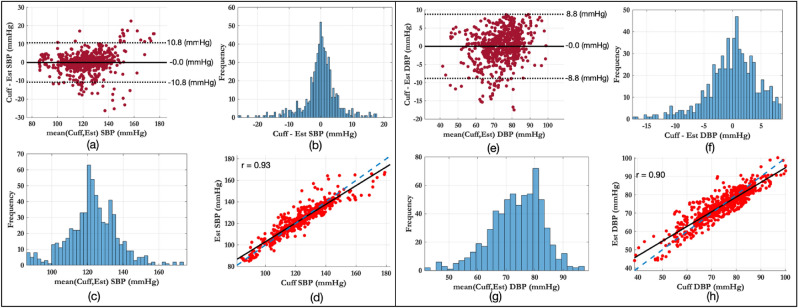
Figure 7.
Agreement between the reference BP values from the sphygmomanometer cuff and the estimated BP values using PAT estimates and the inverse squared model. The left panel shows the results for SBP estimation, the right panel shows the results for DBP estimation. (a,e) The Bland–Altman plots shows no underlying bias. (b,f) The differences between the reference and estimated BP values. (c,g) The distribution of the mean values show that the BP values are within the expected physiological range. (d,h) The correlation is high, with an r of 0.93 for SBP and 0.92 for DBP.

