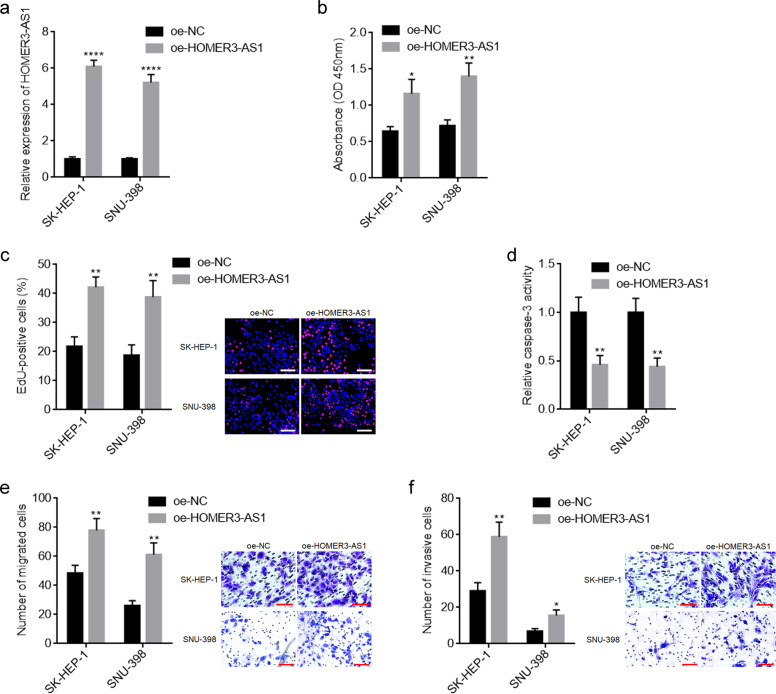
Fig. 2. Overexpression of HOMER3-AS1 promoted HCC cellular malignant phenotype.
a HOMER3-AS1 expression in SK-HEP-1 and SNU-398 cells with HOMER3-AS1 stable overexpression was measured by qRT-PCR. b Cell proliferation of SK-HEP-1 and SNU-398 cells with HOMER3-AS1 stable overexpression was determined by CCK-8 experiments. c Cell proliferation of SK-HEP-1 and SNU-398 cells with HOMER3-AS1 stable overexpression was determined by EdU incorporation experiments. Scale bars, 100 µm. The red color indicates EdU-positive nucleuses and blue color indicates all cellular nucleuses. Results are shown as the ratio of EdU-positive nucleuses to all cellular nucleuses. d Cell apoptosis of SK-HEP-1 and SNU-398 cells with HOMER3-AS1 stable overexpression was determined by caspase-3 activity assays. e Cell migration of SK-HEP-1 and SNU-398 cells with HOMER3-AS1 stable overexpression was determined by transwell migration assays. Scale bars, 100 µm. f Cell invasion of SK-HEP-1 and SNU-398 cells with HOMER3-AS1 stable overexpression was determined by transwell invasion assays. Scale bars, 100 µm. Results are presented as mean ± SD based on three independent experiments. *p < 0.05, **p < 0.01, ****p < 0.0001 by Student’s t-test.

