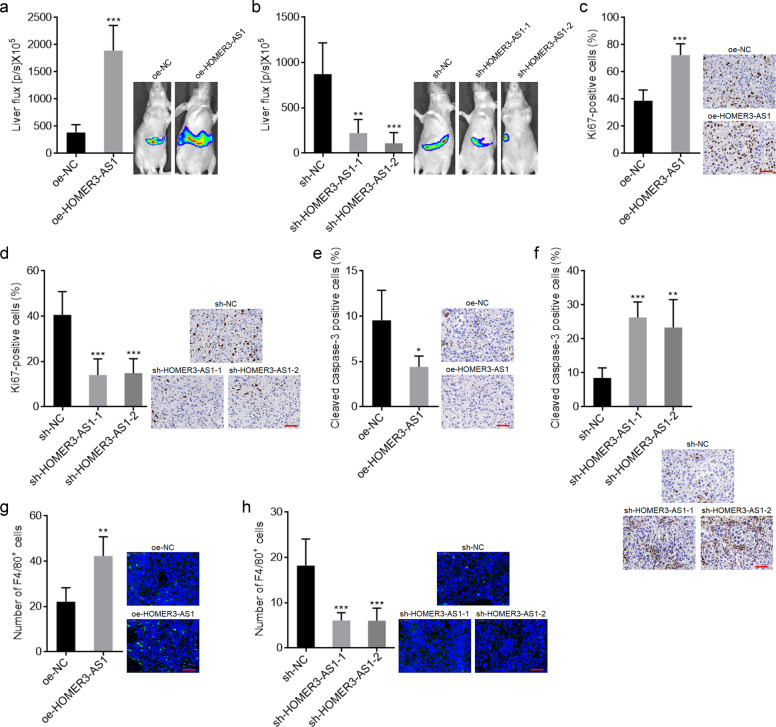
Fig. 3. HOMER3-AS1 promoted HCC tumor progression in vivo.
a Bioluminescence imaging of liver tumors in mice at day 14 after inoculation with small pieces of subcutaneous tumors formed by luciferase labelled SK-HEP-1 cells with HOMER3-AS1 stable overexpression or control. b Bioluminescence imaging of liver tumors in mice at day 14 after inoculation with small pieces of subcutaneous tumors formed by luciferase labelled SK-HEP-1 cells with HOMER3-AS1 stable silencing or control. c Ki67 IHC staining of liver tumors formed by SK-HEP-1 cells with HOMER3-AS1 stable overexpression or control. Scale bars, 50 µm. d Ki67 IHC staining of liver tumors formed by SK-HEP-1 cells with HOMER3-AS1 stable silencing or control. Scale bars, 50 µm. e Cleaved caspase-3 IHC staining of liver tumors formed by SK-HEP-1 cells with HOMER3-AS1 stable overexpression or control. Scale bars, 50 µm. f Cleaved caspase-3 IHC staining of liver tumors formed by SK-HEP-1 cells with HOMER3-AS1 stable silencing or control. Scale bars, 50 µm. g F4/80 IF staining of liver tumors formed by SK-HEP-1 cells with HOMER3-AS1 stable overexpression or control. Scale bars, 50 µm. h F4/80 IF staining of liver tumors formed by SK-HEP-1 cells with HOMER3-AS1 stable silencing or control. Scale bars, 50 µm. Results are presented as mean ± SD based on n = 5 mice in each group. *p < 0.05, **p < 0.01, ***p < 0.001 by Student’s t-test (a, c, e, g) or one-way ANOVA followed by Dunnett’s multiple comparisons test (b, d, f, h).

