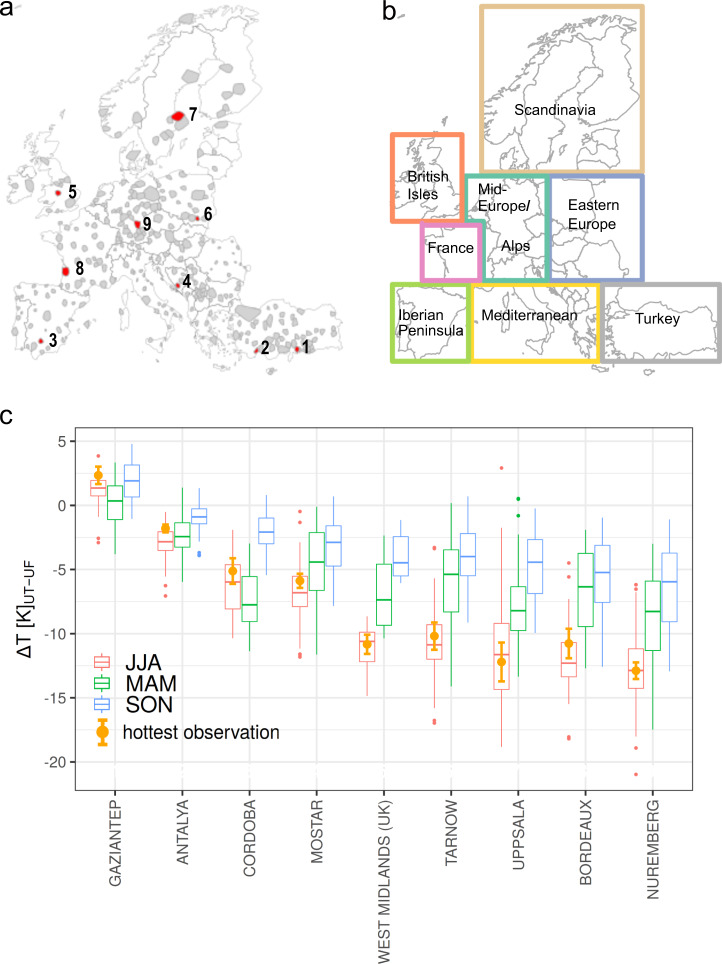
Fig. 2. Temperature differences between urban trees and continuous urban fabric for selected cities in Europe.
a All cities together with their surroundings that were selected for analysis (grey) and cities for which results are shown in more detail (red). In each region, a representative city was selected (except for Turkey, where we show the results for two cities). b Geographic extent of the defined European regions. c The LST differences between continuous urban fabric and areas covered 100% by urban trees (UT urban trees, UF continuous urban fabric). Boxplots of each city indicate the spread of temperature differences calculated for all summertime (JJA) observations (boxes show the first and third quartile; whiskers show the largest/smallest values, but do not extend beyond 1.5 times of the interquartile range; outliers are shown as separate points). The temperature difference observed when the background temperature was highest is shown as an orange dot together with error bars denoting standard errors.

