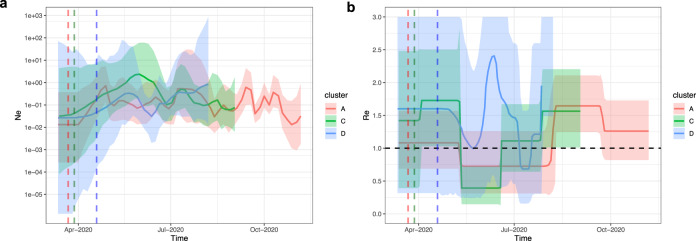
Fig. 5. Bayesian Skygrid and BDSKY analysis reveal spatiotemporal independent population dynamics of Cluster A, C and D.
a Estimation of effective population size (Ne) by Skygrid analysis for Cluster A (red), C (green) and D (blue) sequences. The logarithmic effective number of infections viral generation time (t) representing effective transmissions is plotted over time. 95% HPD intervals are plotted in lighter colours. Vertical dashed line is the mean TMRCA. b Estimation of reproductive number (Re) by BDSKY analysis of Cluster A (red), C (green) and D (blue) sequences. The shaded portion is the 95% HPD interval, and the solid line is the posterior median. Vertical dashed line is the mean TMRCA.

