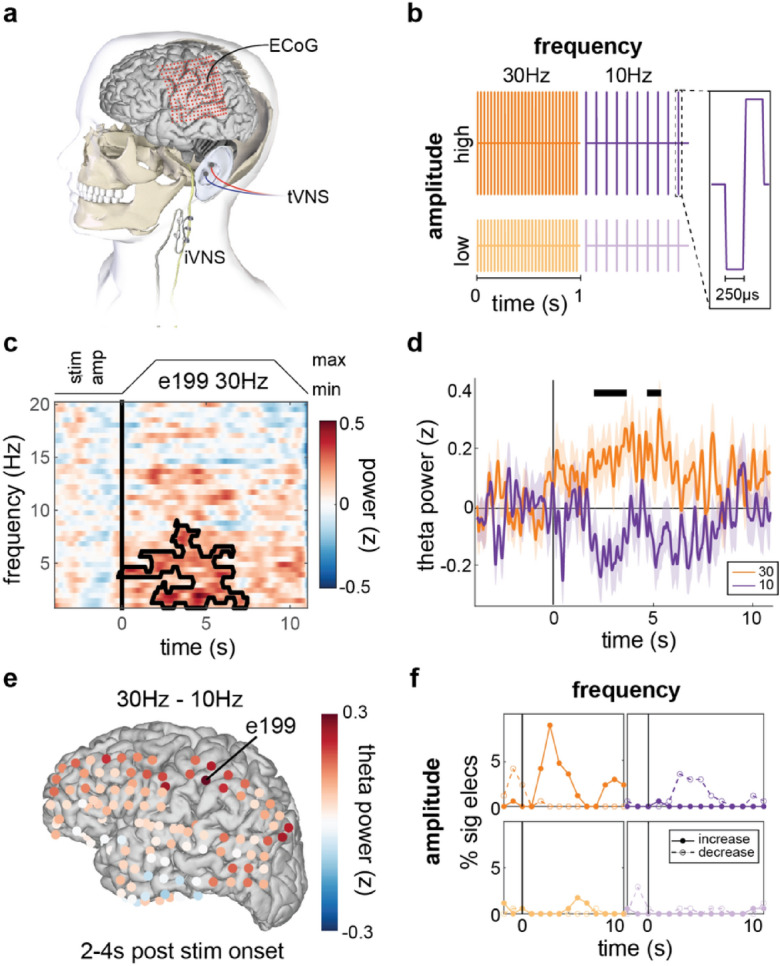
Figure 1.

Implanted VNS (iVNS) evokes small, widespread changes in low frequency spectral band amplitude dependent on stimulation parameters. (a) The vagus nerve can be stimulated directly via an implanted pulse generator and a cuff electrode around the left cervical vagus (iVNS). Electrodes can also be placed on skin of the outer ear for transcutaneous auricular VNS (taVNS). (b) VNS was delivered at two levels of frequency (30 Hz and 10 Hz) and two levels of amplitude (below each participant’s perceptual threshold [high] and half of that level [low]). Stimulation consisted of trains of biphasic square wave pulses (inset). (c) Average neural spectrogram for a single electrode time-locked to onset of 30 Hz iVNS in one example participant (P1). Black boundary line indicates a spectro-temporal cluster with increased amplitude relative to baseline. Stimulation duty cycle shown at top. (d) Mean and standard error of Z-scored analytic amplitude in the Theta band (4–8 Hz) for the same electrode as in (c). Black lines denote temporal clusters corresponding to significant differences between 30 and 10 Hz trials. (e) Difference in average theta amplitude between 30 Hz or 10 Hz iVNS for each electrode from 2 to 4 s after stimulation onset. Greater differences between conditions found across anterior frontal, parietal, and posterior temporal/occipital electrodes. (f) For each stimulation setting (b), the percentage of electrodes showing significant (p < 0.01, uncorrected) theta amplitude increases (solid) or decreases (dashed) relative to baseline within each 2-s window (1 s overlap) time-locked to stimulation onset for this example participant. Across electrodes, 10 Hz and 30 Hz stimulation appear to elicit opposed changes in amplitude, peaking around onset of maximum stimulation amplitude.
