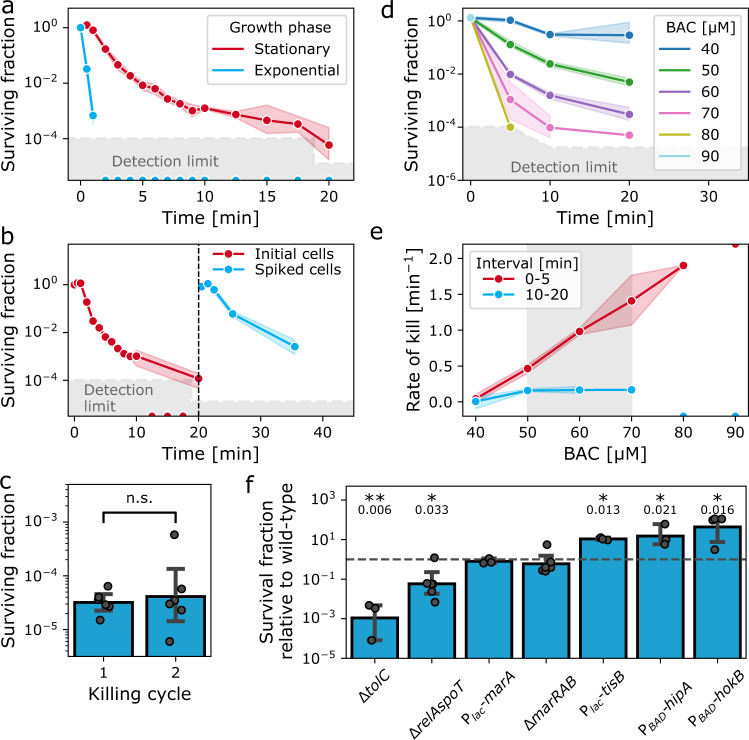
Fig. 1. E. coli forms persisters against benzalkonium chloride.
a Time kill kinetics of exponentially growing and stationary phase E. coli cultures exposed to BAC at 3× MIC (i.e., 60 µM or 21 µg/ml). Points: geometric mean ± 95% C.I. (n = 6 biological replicates). Detection limit: 166 cfu/ml. Half circles on the x-axis indicate replicates with a surviving fraction below the detection limit. b Bimodal killing kinetics are due to a tolerant subpopulation, not due to exhaustion of biologically active BAC from the medium. Fresh cells were spiked into a time-kill assay (dashed line). Points: geometric mean, ± 95% C.I. (n = 3 biological replicates). c The persister plateau is not caused by tolerant or resistant mutants. Bars: geometric mean ± 95% C.I. (n = 6 biological replicates). d Persistence against BAC is observed in a concentration window. Points: geometric mean ± 95% C.I. (n = 3 biological replicates). No viable cells could be detected after 5 min of exposure above 80 µM BAC. Detection limit: 125 cfu/ml. e Concentration dependence of killing kinetics. The initial killing rate is correlated with the BAC concentration (Spearman correlation coefficient 0.958, p = 2 × 10⁻⁷. Significance of correlation: two-sided test with t-distribution of the test statistic). The second killing rate does not correlate with BAC concentration (Spearman correlation coefficient 0.31, p = 0.416). Points: geometric mean ± 95% C.I. as shaded area (n = 3 biological replicates). A lower limit estimate for the first rate at 90 µM BAC is given as a half-circle at the top of the plot. These data points were not included in correlation analysis. f Overlap between mechanisms that generate persisters against BAC and antibiotics. Bars: geometric mean ± 95% C.I. as error bars (n = 3–6 biological replicates). Δ indicates knock-out mutants; Plac, PBAD indicate inducible promoter; for strain details, refer to Table S3. Significance of difference to wild-type indicated by asterisks: p < 0.05; p < 0.01, n.s. not significant (two-tailed unpaired t-test of log-transformed survival fraction). Exact p-values are indicated below the asterisks. Source data are provided as a Source Data file.

