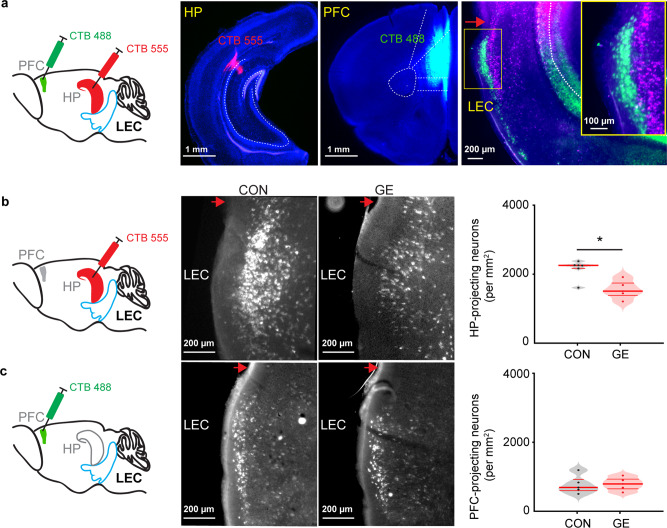
Fig. 4. Long-range monosynaptic axonal projections connecting neonatal LEC, hippocampal CA1, and PFC.
a Schematic of the retrograde tracer CTB488 injection in PFC and CTB555 injection in HP. Digital photomontage showing the CTB555 injection in the HP (left) and CTB488 injection in the PFC (middle) of a P10 CON mouse (total n = 3 mice). Right, digital photomontage displaying CTB555- (red) and CTB488- (green) labeled neurons in LEC of the same mouse. Inset, labeled neurons in LEC shown at higher magnification. The red arrow indicates rhinal fissure. b Left, schematic of the retrograde tracer CTB555 injection in HP. Middle, photographs depicting CTB555-labeled neurons (white dot) in the LEC of a P10 CON and GE mouse. Right, violin plot displaying the number of CTB555-labeled neurons in the LEC of CON (n = 6) and GE (n = 5) mice (one-way ANOVA, p = 0.005, F(1, 9) = 13.44). c Same as b for CTB488 injection in PFC (one-way ANOVA, p = 0.87, F(1, 9) = 0.03). For violin plots, black and red dots correspond to individual animals and the red horizontal lines display the median as well as 25th and 75th percentiles. *p < 0.05.

