
Fig. 9. Light-induced inhibition of entorhinal terminals in HP of CON mice.
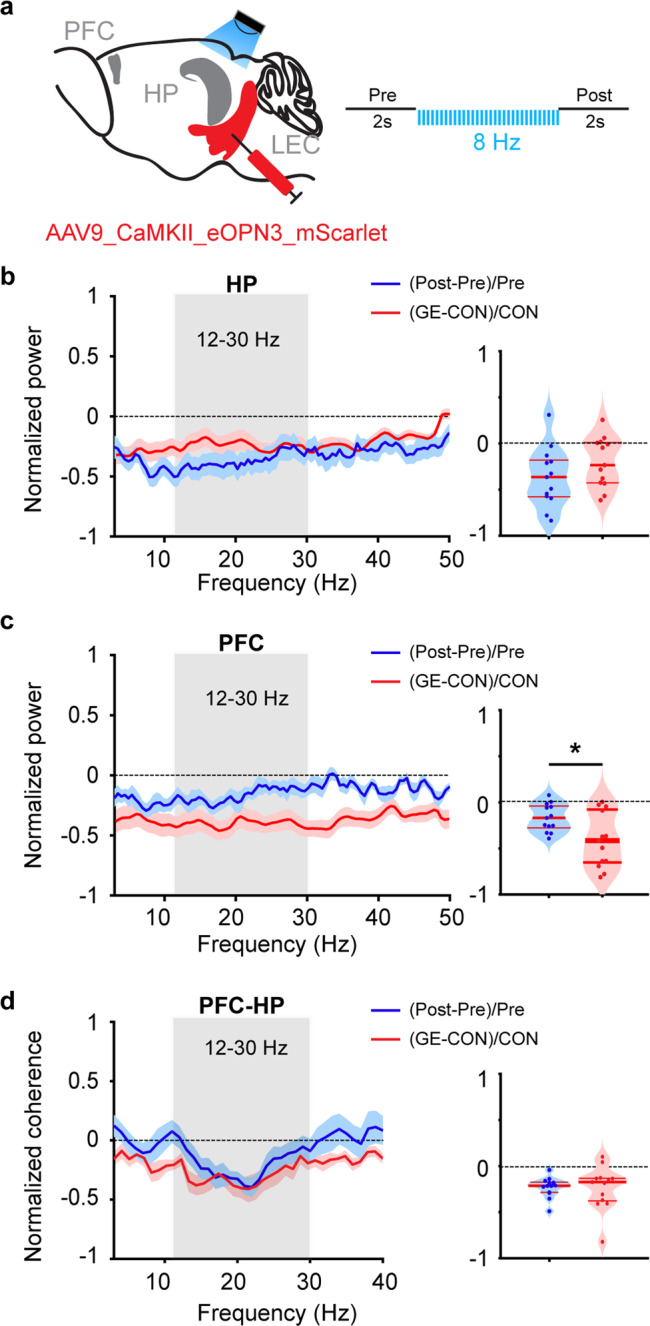
a Schematic of the stimulation protocol of LEC from AAV9_CaMKII_eOPN3_mScarlet-transfected P1 control mice. b Left, power of oscillatory activity in HP after stimulation of LEC axons in HP (post) normalized to the activity before the stimulation (pre) in CON (blue). Red line displays the relative HP power in nonstimulated GE mice. Right, violin plot displaying the average power reduction in 12–30 Hz range (one-way ANOVA, p = 0.158, F(1, 24) = 2.12). c Same as b for PFC (one-way ANOVA, p = 0.016, F(1, 24) = 6.75). d Left, line plots depicting the HP-PFC coherence after pulse stimulation of entorhinal terminals in HP (post) normalized to coherence values before stimulation (pre) (blue). Red line displays the relative HP-PFC coherence in GE mice. Right, violin plot displaying the coherence averaged for 12–30 Hz range (Wilcoxon rank-sum test, p = 0.79, zval = −0.27, ranksum = 176). For b, c, and d the normalized power/coherence measures the power changes related to the activity before the stimulation for light-induced inhibition of entorhinal terminals in HP of CON mice, and to the activity of nonstimulated CON mice for nonstimulated GE mice. For violin plots, blue and red dots correspond to individual animals and the red horizontal lines display the median as well as 25th and 75th percentiles. *p < 0.05.