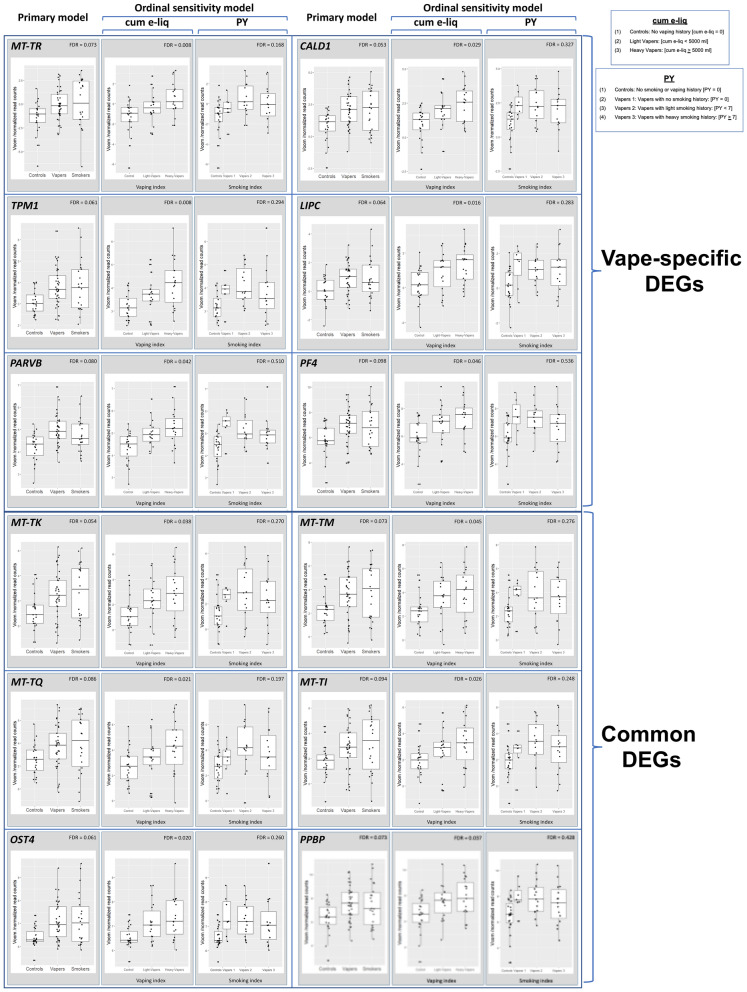
Figure 2.
Visualization of the results of primary and ordinal sensitivity analyses—Vaping. Gene expression results for six vape-specific DEGs (upper panel) and six common DEGs (lower panel), as determined by primary and cum e-liq- and PY sensitivity analyses, are shown. Concordant statistically significant differential expression results for target genes in primary and cum e-liq sensitivity analyses, but not in PY sensitivity analysis, indicates that e-cig use, but not past smoking, is significantly associated with gene dysregulation in vapers. In the cum e-liq model, vapers were divided in two categories, including Light vapers [cum e-liq < 5000 ml], and Heavy vapers [cum e-liq ≥ 5000 ml], with Controls who had no vaping history. In the PY sensitivity model, vapers were stratified into three categories, including Vaper 1: No smoking history [PY = 0]; Vaper 2: Light smoking history [PY < 7]; and Vaper 3: Heavy smoking history [PY ≥ 7], with Controls who had no smoking or vaping history. Distribution of data within each group is shown by a combination of scatter plots (to display individual values) and box and whisker plots (to highlight the minimum, first quartile, median, third quartile, and maximum values as well as outlier(s) (if any)). In the scatter plots, identical values are overlaid and presented as a single circle (‘°’). In the box and whisker plots, the ‘lower’ and ‘upper’ edges of boxes represent the 1st and 3rd quartiles, respectively (25 and 75 percentiles, resp.). Horizontal lines within the boxes represent the medians (2nd quartile or 50 percentile). The ‘lower’ and ‘upper’ vertical lines extending from the boxes, also known as “whiskers”, represent the lowest and highest data points, respectively, excluding any outliers (minimum and maximum values, resp.).

