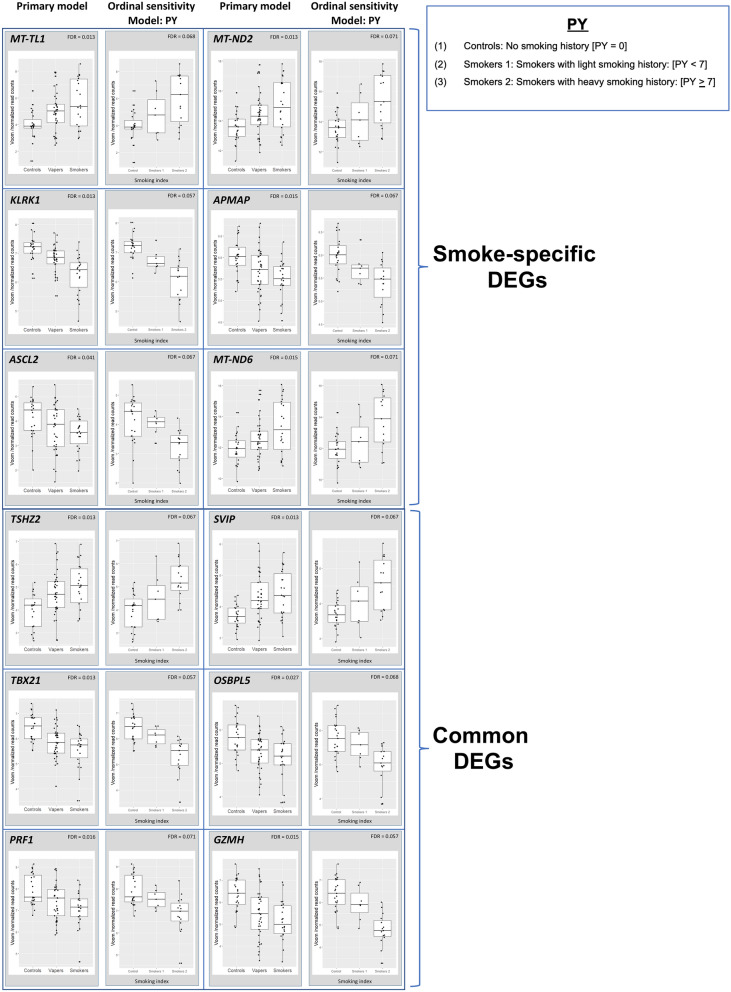
Figure 3.
Visualization of the results of primary and ordinal sensitivity analyses—Smoking. Gene expression results for six smoke-specific DEGs (upper panel) and six common DEGs (lower panel), as determined by primary and PY sensitivity analyses, are shown. Concordant statistically significant differential expression results for target genes in primary and PY sensitivity analyses indicates that smoking dose (i.e., intensity and duration of smoking) is significantly associated with gene dysregulation in smokers. In the PY sensitivity model, smokers were divided in two categories, including Light smokers [Smokers 1: PY < 7], and Heavy smokers [Smokers 2: PY ≥ 7] in comparison to Controls [No smoking history: PY = 0] (see, also legend for Fig. 2).

