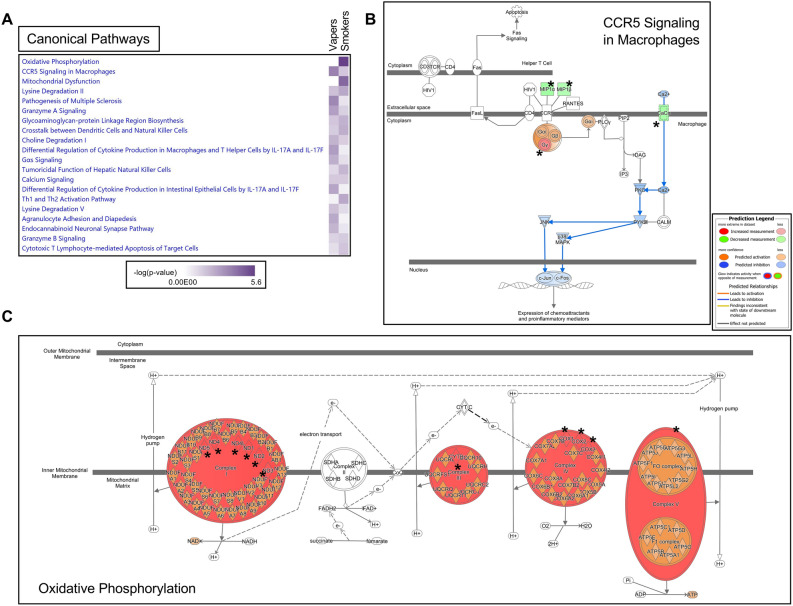
Figure 4.
Canonical pathway analysis of differentially expressed genes in vapers and smokers by IPA. (A) Comparison Analysis was used to identify trends or similarities and differences across the datasets. The heatmap shows the top twenty canonical pathways impacted in vapers and smokers (based on P-value), allowing a direct comparison between the two groups. (B) The ‘CCR5 signaling in macrophages’ pathway was the top dysregulated pathway in vapers (P = 2.15E−04). Affected molecules include CACNA2D2, CCL3/MIP1α, CCL4/MIP1β, and GNG11. (C) The ‘Oxidative phosphorylation’ pathway was the top disrupted pathway in smokers (P = 2.80E−06). Affected molecules include ND1, ND2, ND3, ND4, ND4L, and ND5 (Complex I), Cyt b (Complex III), CO1, CO2, and CO3 (Complex IV), and ATP6 (Complex V). In both cases, Molecule Activity Predictor (MAP) analysis was used to predict how up-regulated and down-regulated genes in the datasets (red and green nodes, respectively) can affect the activity of other molecules on the pathway. For clarity, the affected genes are indicated by asterisks in the two pathways. Orange nodes, prediction of activation; blue nodes, prediction of inhibition.

