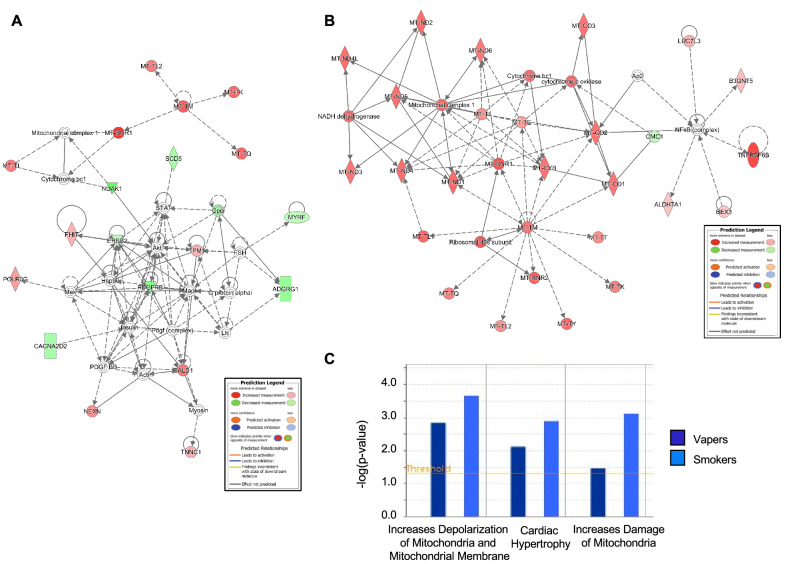
Figure 5.
Gene networks and toxicity functions analysis of differentially expressed genes in vapers and smokers by IPA. The top functional networks impacted in (A) vapers and (B) smokers show high enrichment of mitochondrial genes. Red and green nodes represent up-regulated and down-regulated DEGs, respectively. White nodes show molecules that are not included in the datasets but interact with other components of the network. Solid line, direct interaction; dashed line, indirect interaction. (C) The IPA-Tox analysis tool was used to catalogue sets of molecules in the list of DEGs that were known to be involved in a particular type of toxicity or phenotype. Major toxic effects associated with DEGs in vapers (dark blue) and smokers (light blue) include increased depolarization of the mitochondrial membrane and damage of the mitochondria.

