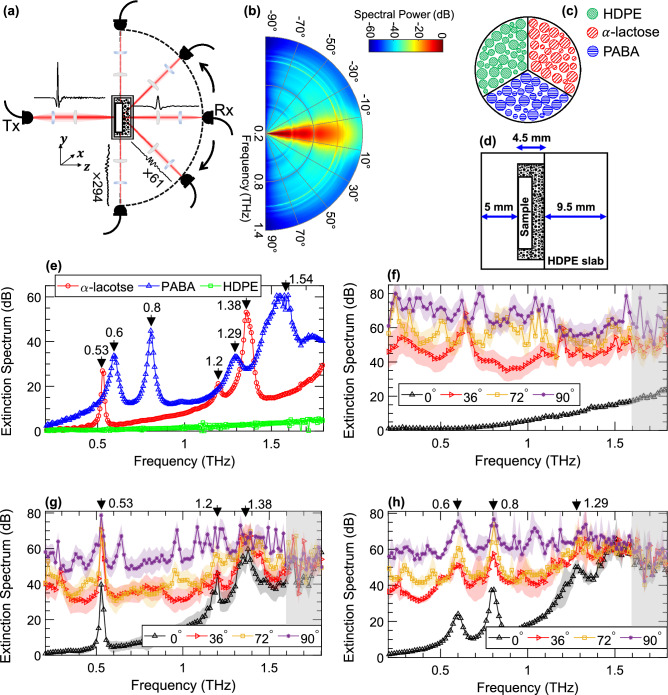
Figure 1.
Diffuse-wave THz-TDS, (a) a schematic of the imaging apparatus designed for the measurement of the ballistic and diffuse THz fields, example THz-TDS signals, multiplied by the normalization factors for visualization purposes only, are given at different angles, (b) the angular distribution of the scattered THz spectral power (jet color map generated in MATLAB R2020b, https://www.mathworks.com/products/matlab) measured through the sample embedded in the loosely-packed LDPE powders, showing a 60 dB decline from to 90°, (c) a schematic presentation of the imaging target outlining the regions covered by each chemical (i.e., HDPE (green circles), -lactose (red circles), and PABA (blue circles)), (d) a schematic of the sample housing made from two HDPE slabs, a reservoir is made into one of the slabs to contain the sample pellet and the turbid medium surrounding it, (e) the extinction spectrum of the chemicals in the imaging target, measured without any scattering layers in the beam path, revealing the characteristic resonant frequencies, (f-h) the extinction spectra measured at four different detection angles including , 36°, 72°, and 90° from the pixels containing HDPE (the green circles in (c)), -lactose monohydrate (the red circles in (c)), and PABA (blue circles in (c)), respectively, each line in (f-h) shows the average extinction coefficient along its standard deviation over the pixels associated with each chemical.

