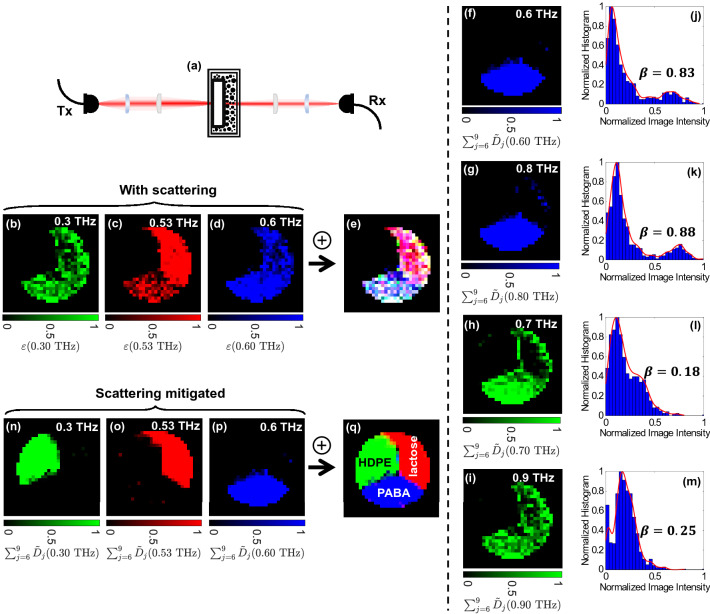
Figure 2.
Terahertz chemical mapping through turbid media, (a) the imaging apparatus at the detection angle , (b) the normalized extinction coefficient at 0.3 THz (green color map), (c) 0.53 THz (red color map), (d) 0.6 THz (blue color map), (e) the superposition of the images in (b-d), (f) image formed using the normalized summation of the sixth to ninth-level wavelet details vectors at 0.6 THz (i.e., (0.6 THz)), (g) (0.8 THz), (h) (0.7 THz), (i) (0.9 THz), (j-m) the normalized histograms of the images shown in (f-i), respectively, the bimodality coefficient value is given for each histogram, (n) the normalized summation of the sixth to ninth-level wavelet details vectors at 0.3 THz (green color map), (o) 0.53 THz (red color map), (p) 0.6 THz (blue color map), and (q) the superposition of the images in (n-p). The color maps are generated using MATLAB R2020b, https://www.mathworks.com/products/matlab.

