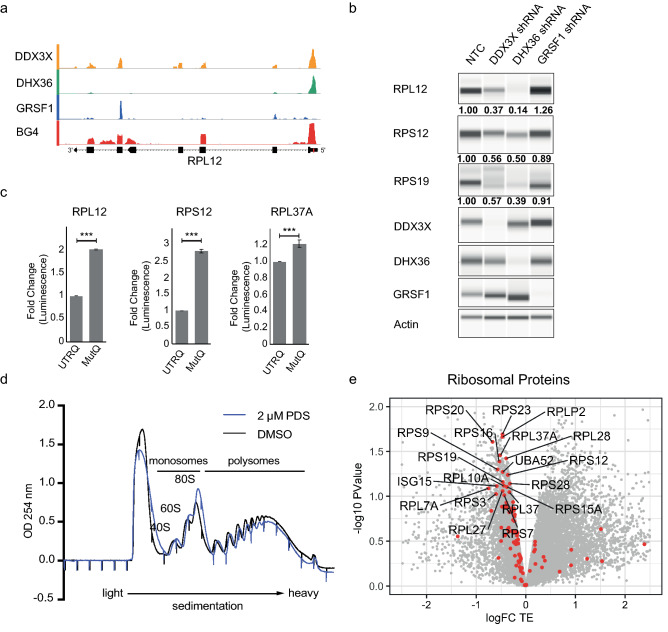
Figure 3.
RNA G4s in ribosomal protein mRNA regulate translation. (a) Example snapshots demonstrating BG4 peaks in 5′ UTRs and overlapping iCLAE peaks. BG4 track depict logFC of BG4 IP vs input and iCLAE track depict counts per million. (b) Western blot analysis of ribosomal protein levels following shRNA mediated depletion of DDX3X, DHX36 and GRSF1. Actin serves as loading control. Number below each lane represents fold change in ribosomal protein levels compared to non-targeting control (NTC) when normalised to actin. (c) Fold change in luminescence comparing in vitro translation of luciferase gene from wild-type ribosomal protein UTRs containing G4 (UTRQ) to mutant UTRs with G4 disruption (MutQ). (d) UV absorption at 254 nM following sucrose fractionation for polysome profiling of cells treated with DMSO (black) and 2 μM PDS (blue) for 45 min. Monosomal and polysomal fractions are highlighted. (e) Fold change in translation efficiency (logFC TE) of each transcript plotted against the significance (− log10 p-value) over three independent biological replicates. All ribosomal protein mRNAs are highlighted in red and those with significant changes (FDR < 0.1) are labelled with the corresponding protein names.

