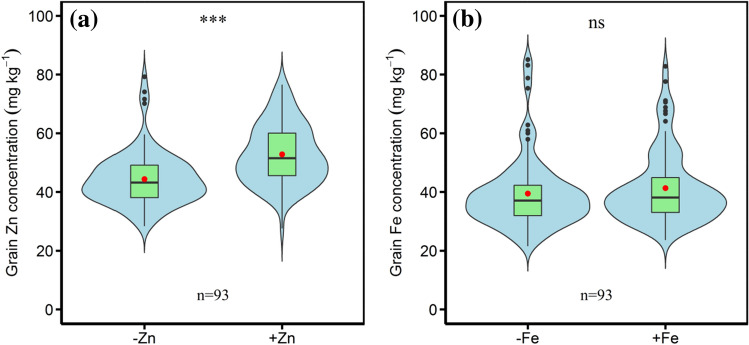
Figure 4.
Effects of foliar application of micronutrients on the grain concentrations of (a) zinc and (b) iron of the ninety-three wheat accessions. Note: −Zn and + Zn indicate without and with foliar zinc application, respectively, − Fe and + Fe indicate without and with foliar iron application, respectively. The boxes boundaries indicate the 75% and 25% quartiles; whiskers indicate the 95% confidence limits; the black circles indicate outliers; the solid horizontal line and red circle indicate median and mean, respectively. ∗ ∗∗ is statistically significant at P < 0.001, ns indicate not significant at P < 0.05.

