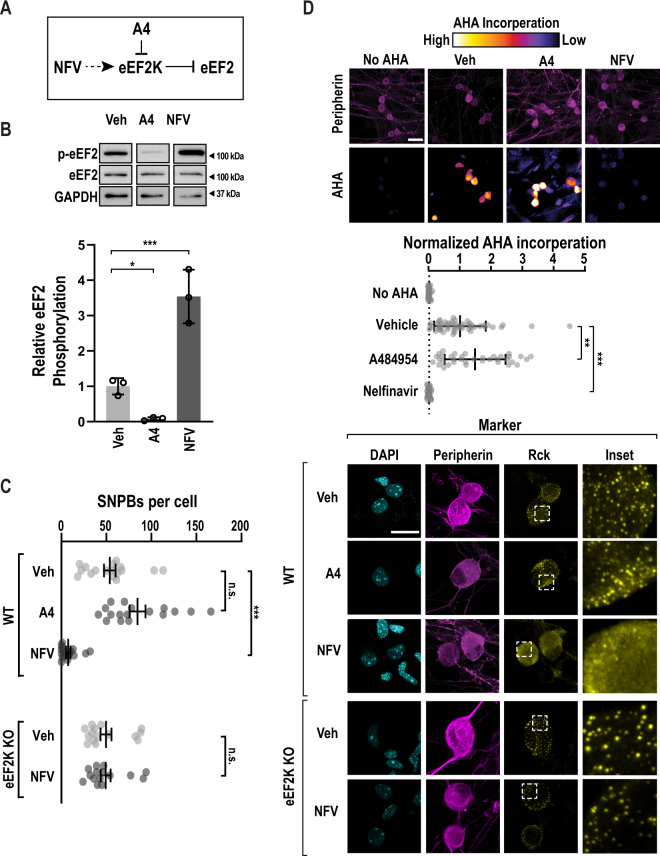
Fig. 2. eEF2K controls p-body numbers in sensory neurons.
A A schematic depicting the effects of an eEF2K inhibitor, A484594 (A4), or an eEF2K activator, Nelfinavir (NFV) on eEF2K and eEF2. B Primary DRG cultures were again treated with vehicle (Veh), A484954 (A4, 25 µM), or nelfinavir (NFV, 50 µM). Lysates from treated cells were probed for p-eEF2, eEF2, and GAPDH (load control). D upper Representative immunoblots (cropped to depict one representative band per condition). D lower Quantification represents mean p-eEF2/eEF2 signal, n = 3 biological replicates. Error bars represent ±SD. P-values determined by one-way ANOVA. Veh vs. A4 p = 0.0493, Veh vs. NFV p = 0.0010. C Primary DRG cultures were treated with vehicle (Veh), an eEF2K inhibitor, A484594 (A4), or an eEF2K agonist, Nelfinavir (NFV) for a period of 1 h. As a specificity control, NFV, was applied to DRG neurons obtained from eEF2K homozygous loss of function animals (n = 15). As before, peripherin (magenta) and Rck (yellow) immunofluorescence were used to identify neurons and SNPBs, respectively. A left Representative confocal images. Scale bar = 20 µm. A right Quantification of SNPBs in peripherin-positive cells. For Veh, A4, and NFV n = 17, 17, and 16 cells, respectively. The error bars represent mean ± S.E.M. p-values determined by one-way ANOVA. Veh vs. NFV p < 0.0001. D Primary WT DRG cultures were treated as in B with the addition of a 30-minute pulse of AHA. As before, cells were subjected to FUNCAT and peripherin immuno-labeling and imaged via confocal microscopy. To quantify the baseline, a control group without AHA was imaged. C upper Representative confocal images. Scale bar = 30 µm. D lower Quantification of mean AHA incorporation in peripherin-positive cells, normalized to signal from AHA-free cells. For No AHA, Veh, A4, and NFV n = 30, 53, 36, and 28 cells, respectively. Bars indicate mean ± SD p-values determined by one-way ANOVA. Veh vs. A4 p = 0.0016, Veh vs. NFV p < 0.0001. Source data are provided as a Source Data file. Uncropped blots are presented in Supplemental Fig. 7.

