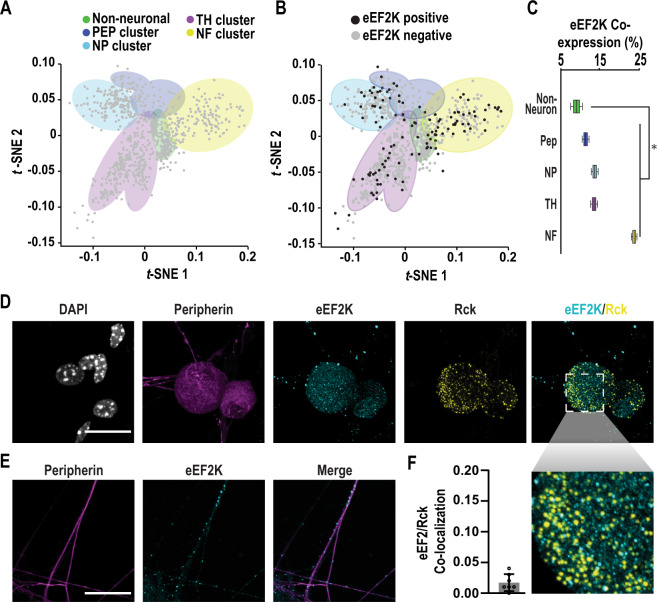
Fig. 3. eEF2K is expressed in sensory neurons but does not localize to SNPBs.
A Single cell clusters based on expression of marker genes for the following populations of cells: non-neuronal (Vim), peptidergic (Calca/CGRP), non-peptidergic (Mrgprd), tyrosine hydroxylase (Th), and a light chain neurofilament expressed in large diameter neurons (Nefh). Data were obtained from Usoskin and colleagues and subjected to unbiased clustering75,76. B eEF2K expression in individual cells within these clusters. C Quantification of co-expression of eEF2K with marker transcripts. Boxes display mean, first, and third quartiles. Whiskers indicate minimum and maximum values. P value determined by Fisher’s exact test, one tailed, significance of 0.05. p = 0.0357. For non-neuronal, PEP, NP, TH, and NF clusters n = 88, 73, 141, 280, and 167 cells, respectively. For details on analysis, see Methods. D Untreated primary DRG cultures were used for ICC and imaged with confocal microscopy. Representative images of cells labeled for peripherin (magenta), eEF2K (cyan), and Rck (yellow). Nuclei were stained with DAPI (white). Scale bar = 20 µm. E Axons of cells from D were also imaged. Representative confocal images show peripherin (magenta) and eEF2K (cyan) immunofluorescence signals within axons. Scale bar 20 µm. F Mean colocalization of eEF2K and Rck immunofluorescence signals within peripherin-positive cell bodies using Pearson’s correlation coefficient (PCC), n = 7 cells. Mean Pearson’s = 0.017. Error bars indicate ±SD. Source data are provided as a Source Data file.

