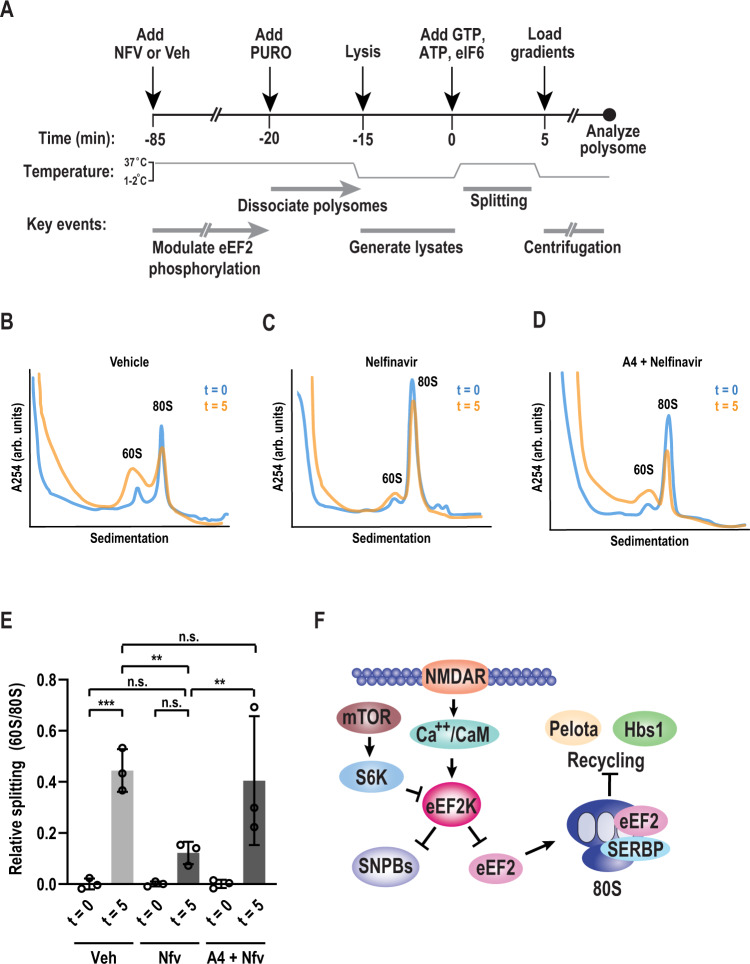
Fig. 7. Nelfinavir-induced monosomes are resistant to recycling.
A Schematic diagram of in vitro splitting assay. Cells were treated for 1 h with vehicle (Veh) or nelfinavir (NFV), followed by 50 µM puromycin (PURO) for 5 min. Cells were then lysed and clarified by centrifugation. Splitting assays were initiated with the addition of ATP (1 mM), GTP (1 mM), and eIF6 (5 µM), and transferred to 37 °C for 5 min. Reactions were halted by cooling samples on ice before performing polysome profiles. B Representative polysome profiles from splitting assays following vehicle treatment performed pre-splitting (t = 0, blue) and post-splitting assay (t = 5, orange). C Representative polysome profiles from splitting assays following nelfinavir treatment performed pre-splitting (t = 0, blue) and post-splitting assay (t = 5, orange). D Representative polysome profiles from splitting assays in cells pre-treated with A4 (25 µM) followed by nelfinavir treatment performed pre-splitting (t = 0, blue) and post-splitting (t = 5, orange). E Quantification of relative splitting, as measured by the ratio of 60S peak height to 80S peak height. Initial ratios (t = 0) were subtracted from corresponding treatment groups. Error bars represent mean ± SD. n = 3 biological replicates. P-value determined by one-way ANOVA. Veh t = 0 vs Veh t = 5 p = 0.0004, Veh t = 0 vs NFV t = 5 p = 0.2039, NFV t = 0 vs. NFV t = 0 p = 0.2039 Veh t = 5 vs NFV t = 5 p = 0.0038, NFV t = 5 vs A4+NFV t = 5 p = 0.0086, Veh t = 5 vs. A4+NFV t = 5 p = 0.6673. F A proposed model highlighting eEF2K functions in sensory neurons. Source data are provided as a Source Data file.

