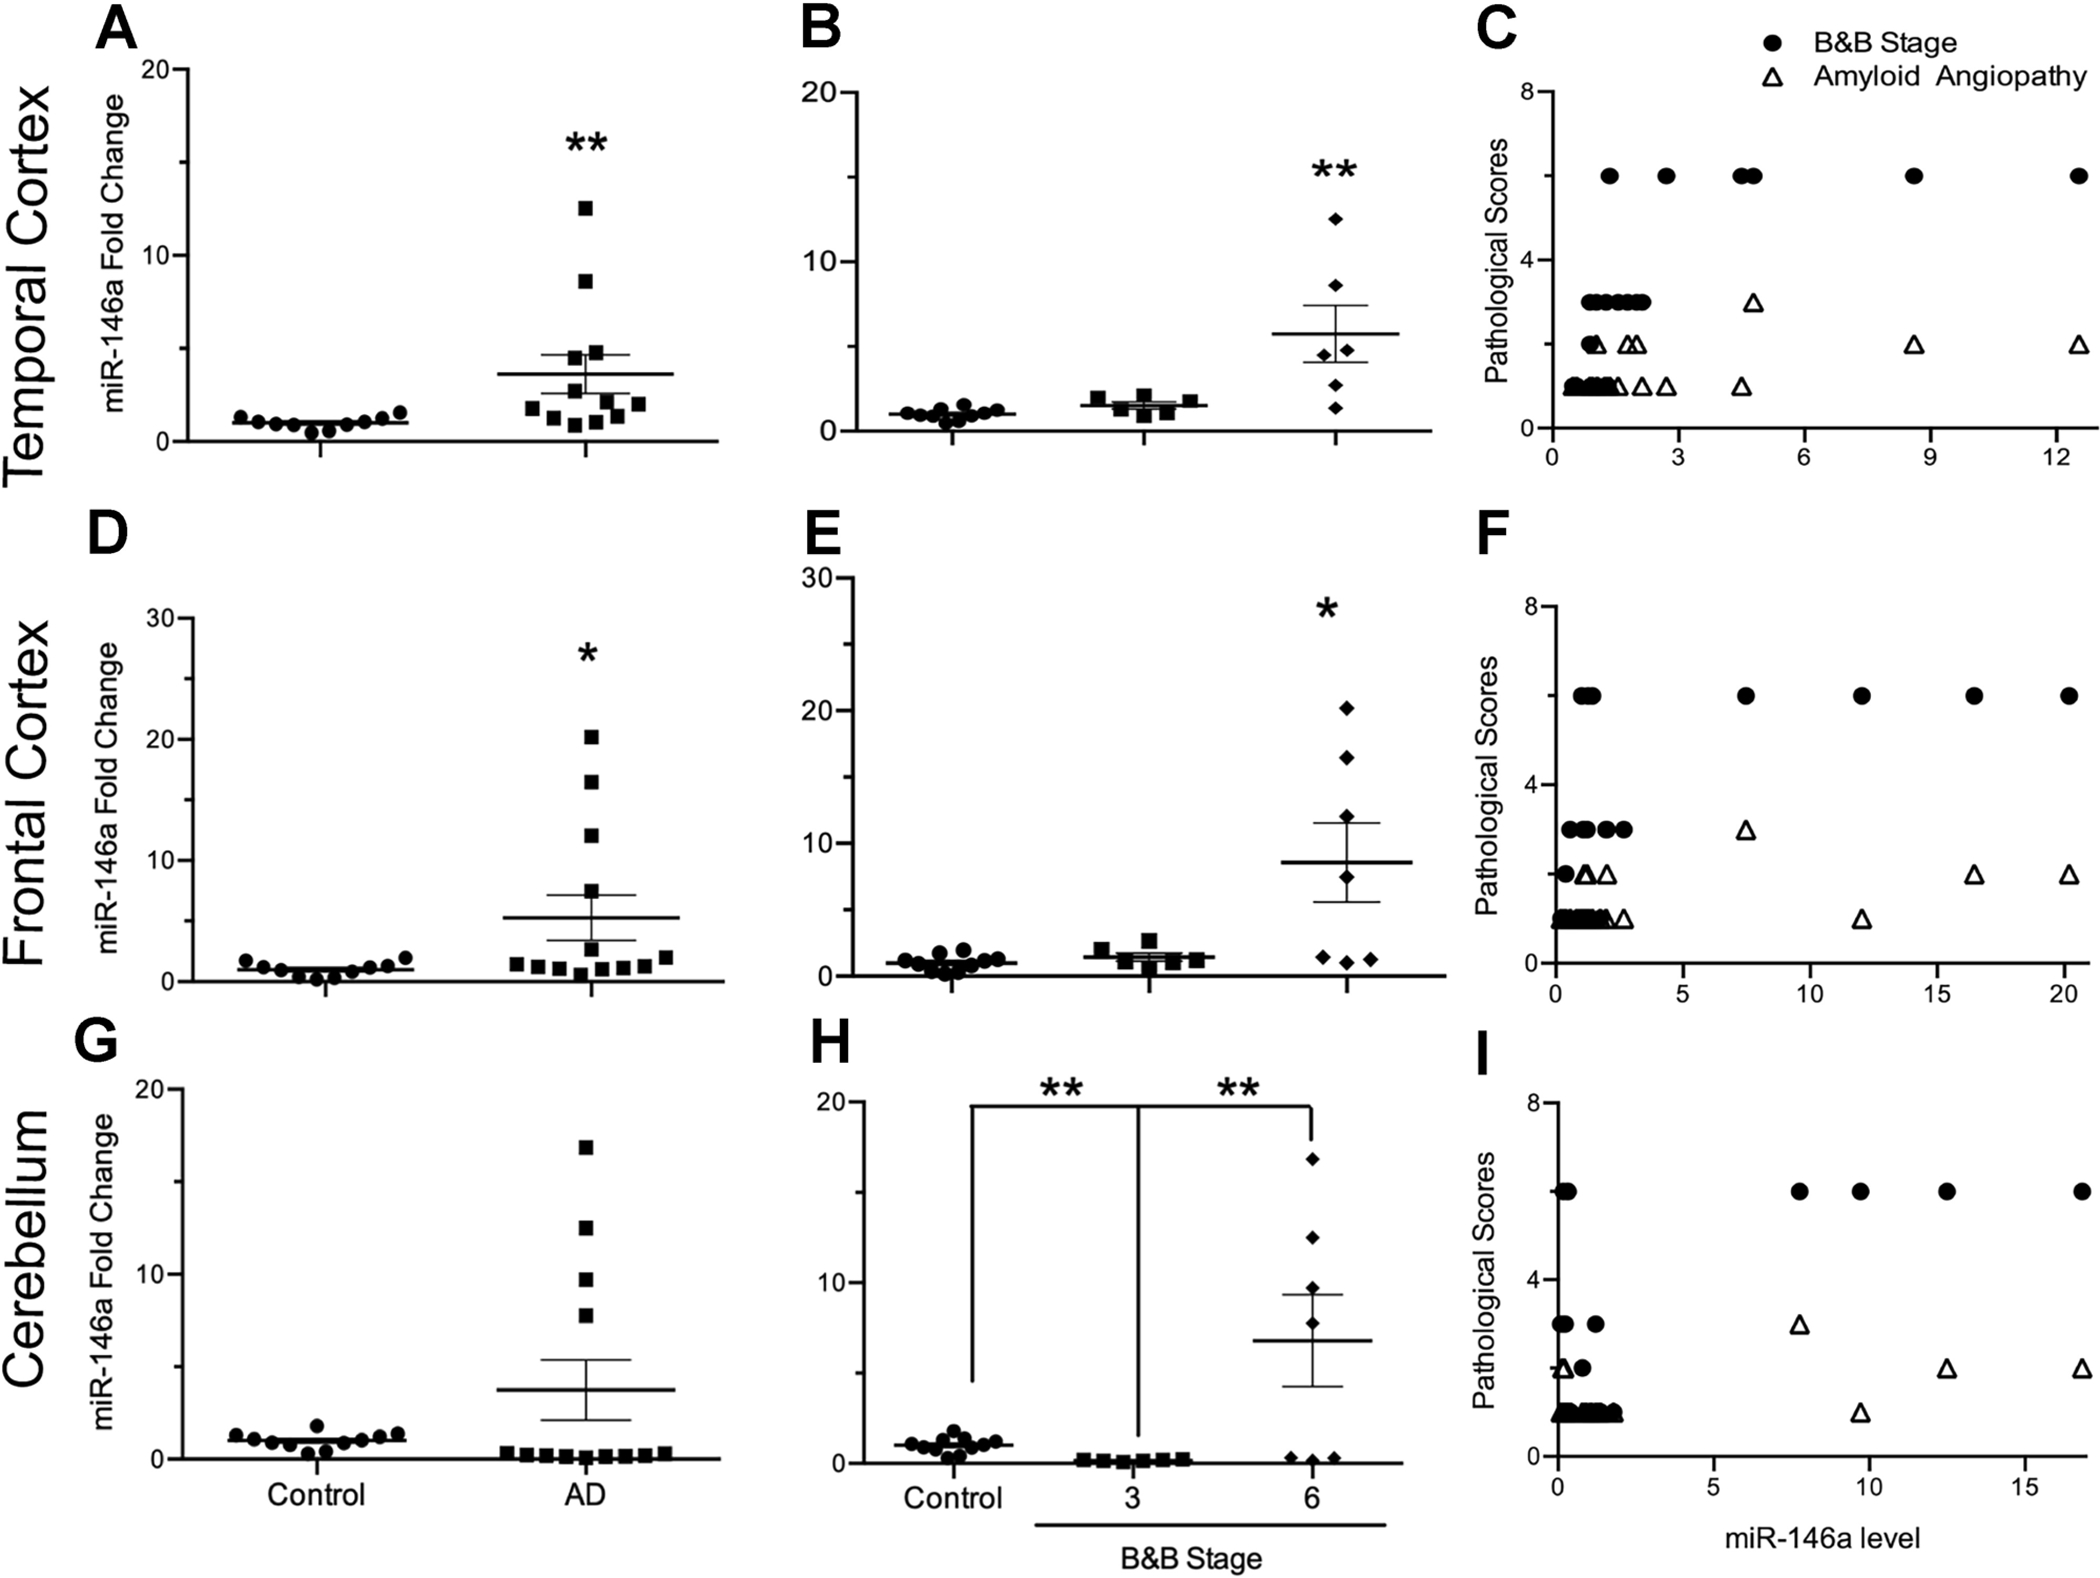
Figure 5. miR-146a profile and correlation with pathology in human Alzheimer’s disease (AD) regions compared to age-matched controls (AMC) in temporal cortex, frontal cortex, and cerebellum.

Relative fold change of miR-146a levels in AD cases (n=13) compared with AMCs (n=10) shows significant increases in the temporal cortex (A; t11.2 = 2.54, p ≤ 0.05, ηp2 = 0.60) and frontal cortex (D; t12.2 = 2.29, p ≤ 0.05, ηp2 = 0.55) of AD brains when compared to AMCs, while there were no significant changes in the cerebellum (G; t12.2 = 1.67, p = 0.12, ηp2 = 0.43). Of the AD brains, seven AD cases were diagnosed as Braak & Braak (B&B) stage VI, and six were diagnosed as stage III. The relationship of miRNA expression with B&B stage (control, 0 vs. 3 vs. 6) was also assessed to determine B&B stage specific miR-146a expression in human brains. Significant differences were identified within the temporal cortex (B; F2,19 = 9.91, p ≤ 0.01, ω2 = 0.45), frontal cortex (E; F2,20 = 7.05, p ≤ 0.01, ω2 = 0.35) and cerebellum (H; F2,21 = 7.19, p ≤ 0.01, ω2 = 0.34). Correlation of miR-146a expression with B&B stage or cerebral amyloid angiopathy (CAA) was calculated by using Spearman’s rho (ρ). Significant correlations between miR-146a with B&B stage were observed in the temporal (C; ρ = 0.77, p ≤ 0.001) and frontal cortices (F; ρ = 0.58, p ≤ 0.01), but not in the cerebellum (I: ρ = −0.01, p = 0.96). Similarly, miR-146a expression was significantly correlated with CAA in the temporal (C; ρ = 0.53, p ≤ 0.05) and frontal cortices (F; ρ = 0.48, p ≤ 0.05), but not in the cerebellum (I; ρ = 0.08, p = 0.70). Data are presented as means ± SEM with significance as *p≤0.05, **p≤0.01, ***p≤0.0001 compared to control.
