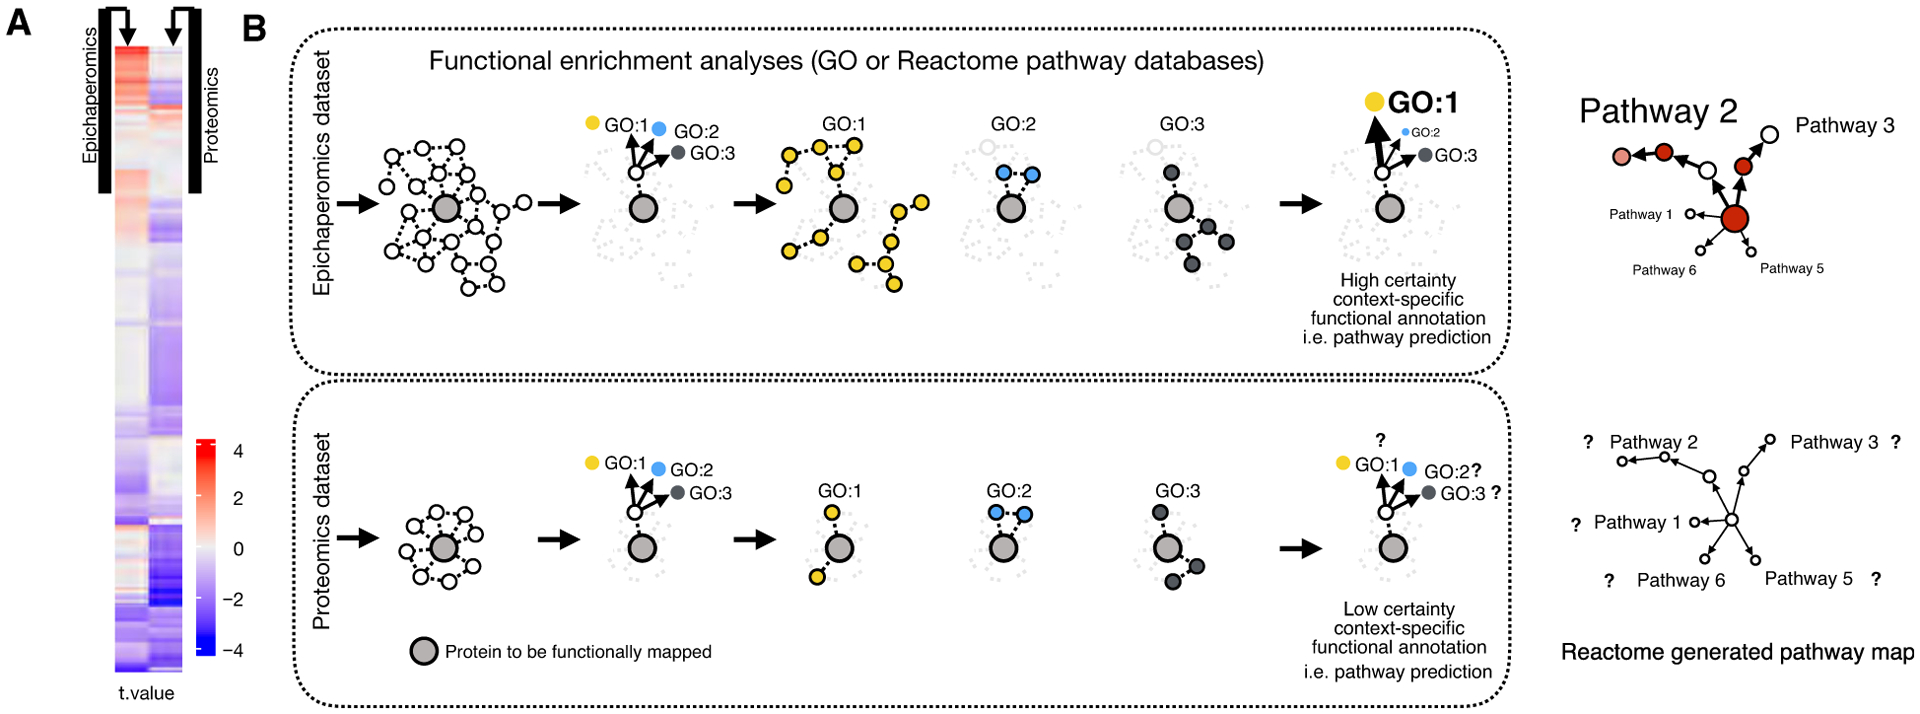
Fig. 1.

(A) Changes in protein connectivity are independent of protein expression changes, and changes in expression levels do not necessarily equate to changes in connectivity. Epichaperomics and proteomics detected proteins in AD (postmortem AD brain samples {Females (F, n = 8) vs Males (M, n = 6)}). For epichaperomic analysis (left panel), MS-derived files were subjected to Label-Free Quantification analysis using the MaxQuant proteomic data analysis workflow [72]. For proteomic analysis (right panel), quantitative bottom-up proteomics was performed using isobaric mass tag TMT10plex labeling reagents [142]. The calculated differences (t-values) were reordered based on hierarchical clustering. Results indicate connectivity, and expression level changes are independent. (B) Schematic showing the influence of identified proteins in a dataset on the ability to make tissue-specific functional predictions. A single protein may carry out different functions with different partners in different biological contexts. Determining if a differentially expressed protein (for proteomics) or differentially connected protein (for epichaperomics) is associated with a certain biological process or molecular function depends on the enrichment of its partners in the specific dataset. Gene Ontology (GO), which contains standardized annotation of proteins, is commonly used for this purpose. It works by comparing the frequency of individual annotations in the protein list with a reference list. Enrichment of biological pathways supplied by Reactome, WikiPathways, KEGG (Kyoto Encyclopedia of Genes and Genomes), or other pathway analysis resources can be performed in a similar manner.
