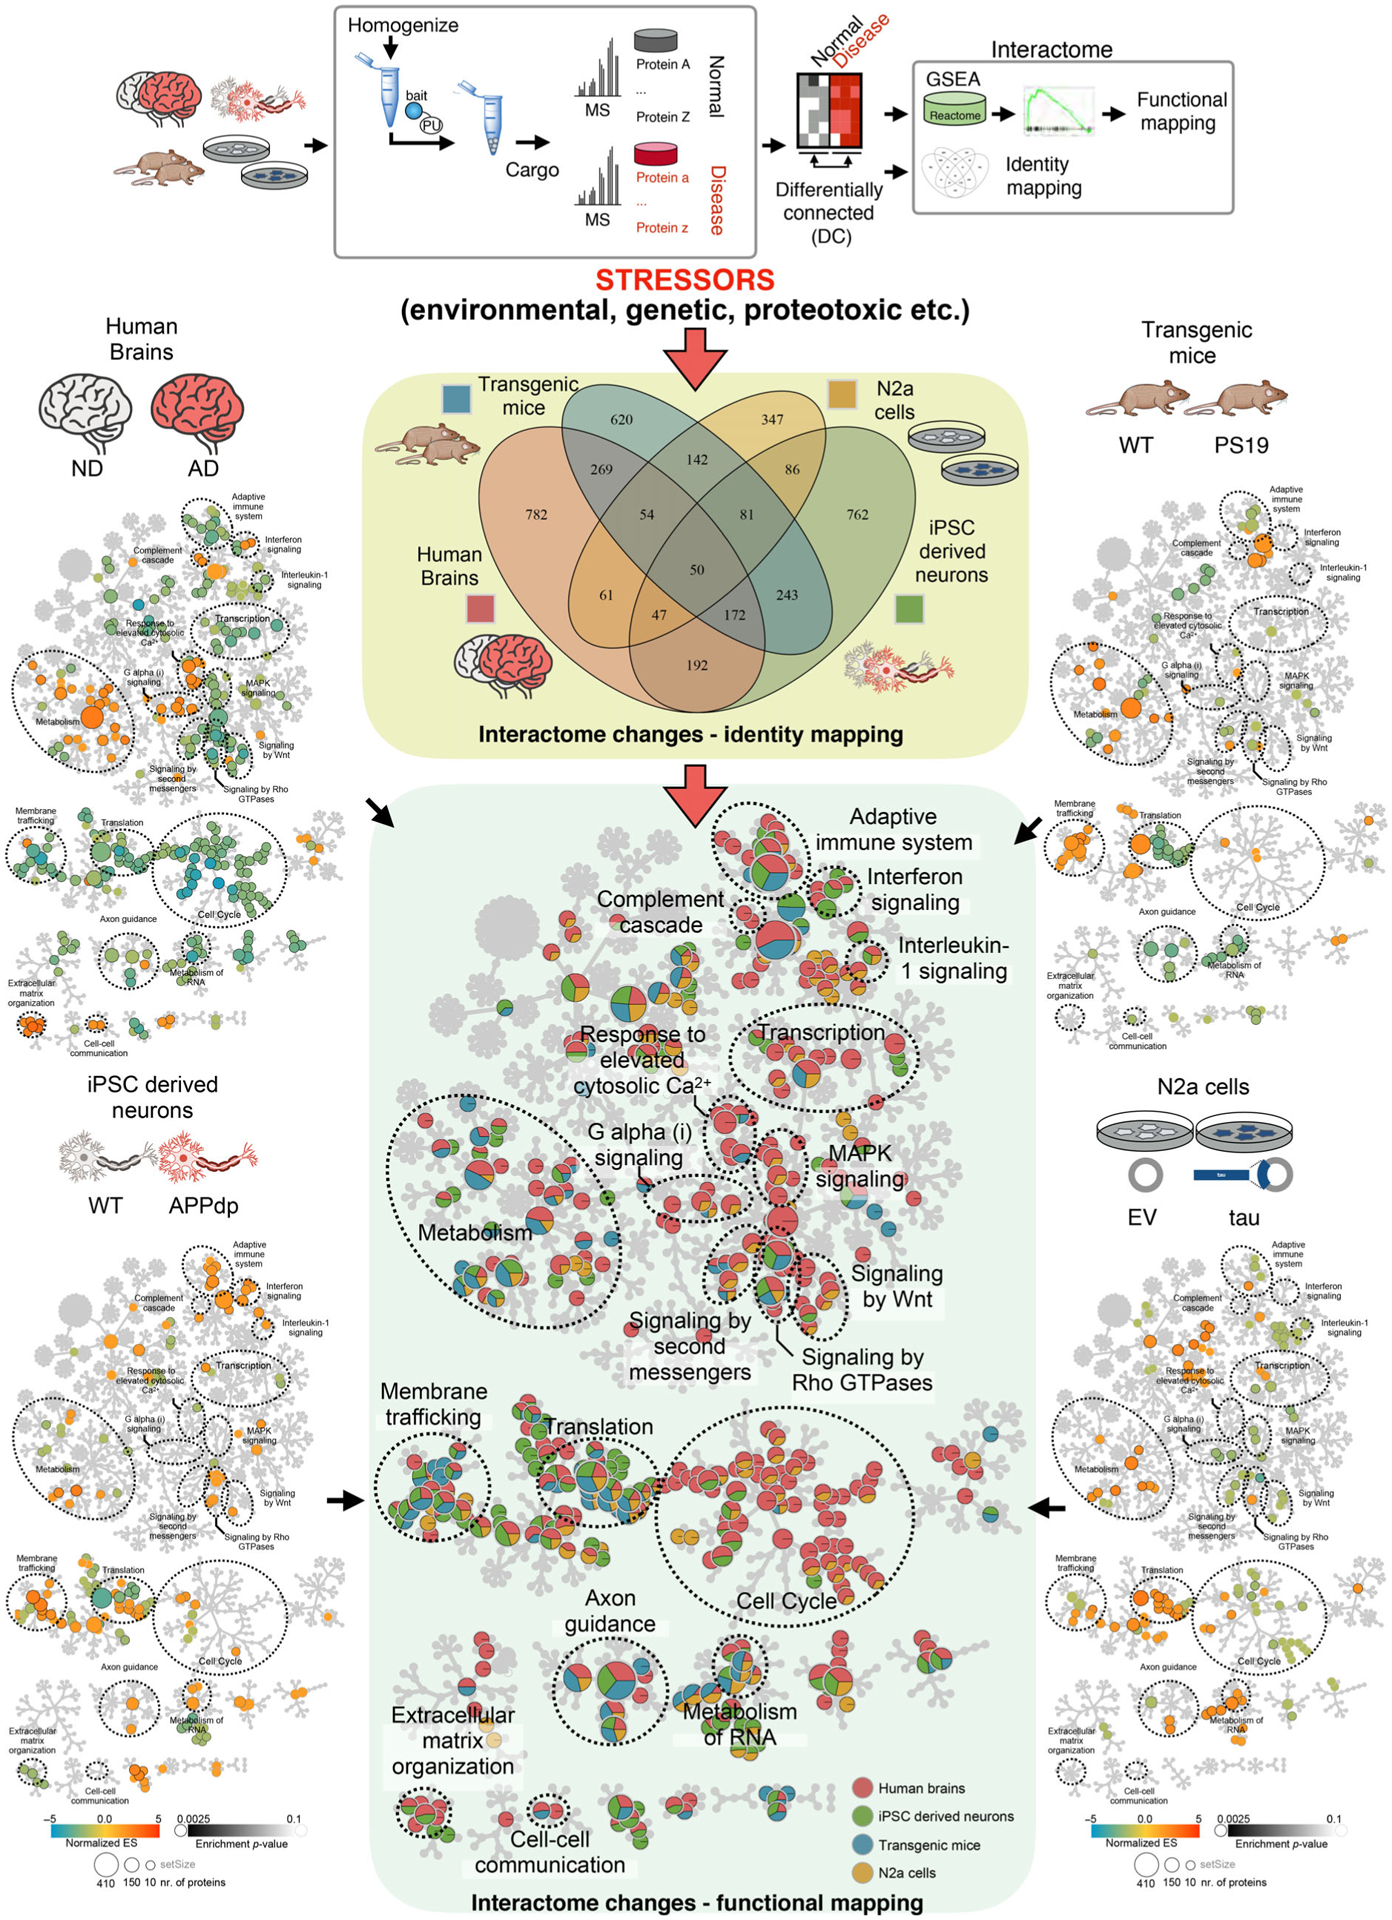
Fig. 3.

Interactome changes as identified by epichaperomics following individual AD- and AD-relevant model stressor conditions via Venn diagram and Reactome pathway enrichment analyses. In the Venn diagram (center), each circle represents the number of proteins whose connectivity is significantly affected by each stressor. In the Reactome maps, generated in Cytoscape, each circle represents a function (i.e., a protein pathway). The center Reactome map is a merged map depiction of all four individual stressor conditions (left- and right-side panels). If the circle is divided into blue, yellow, red and green segments, it means all four stressors (or stressors characteristic of each condition) mediate imbalances in the select pathway. An exclusively red circle indicates the pathway alteration is AD-specific. Key: human brains (sporadic late-onset AD vs NCI), iPSC-derived neurons (APP duplication vs WT), transgenic mouse brains (PS19 vs WT), and cellular models of human tau toxicity (N2a cells overexpressing human tau vs N2a cells with vector only). Figure adapted from [72].
