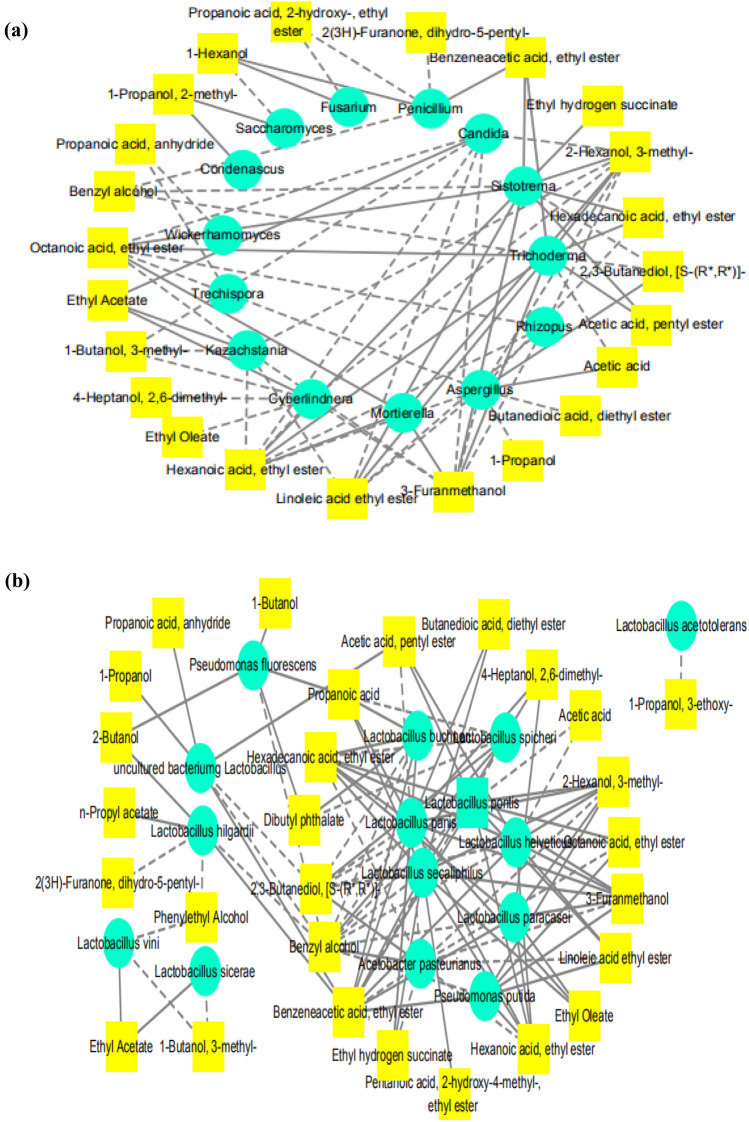
Fig. 6.
Correlation network diagram among dominant fungal genera (a), bacterial species (b), and volatiles (Note: Microbes and volatiles are represented by green circle and yellow square modules, respectively; Positive and negative correlations among dominant genera are represented by solid and dotted edges, respectively)

