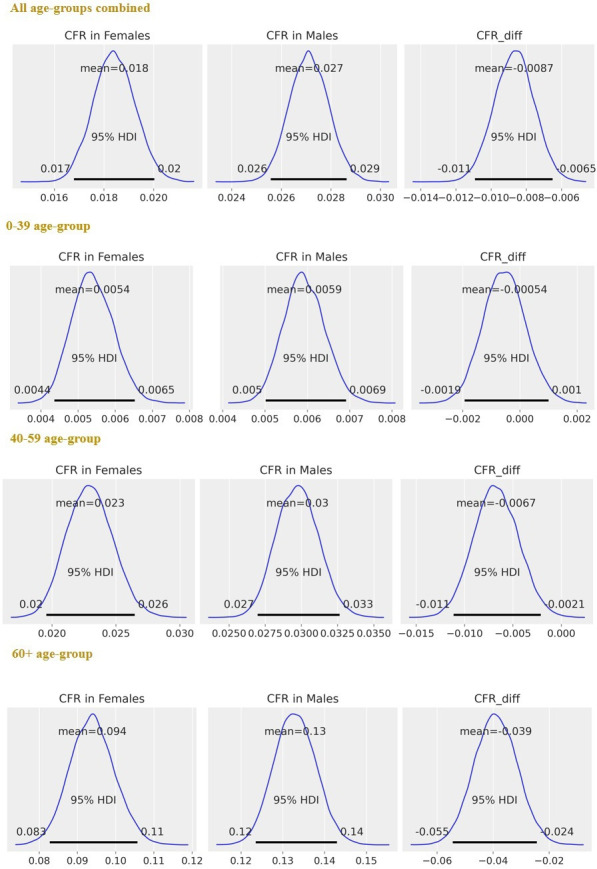
Figure 2.

SSA-specific estimates, after merging the data from 20 SSA countries: posterior distributions of CFR in women, CFR in men and (=CFR in women – CFR in men), for each age group and all age groups combined. The horizontal black line represents the 95% HPDs. Ninety-five per cent HPD intervals are the same as that of 95% HDIs. Ninety-five per cent HPDs for do not contain 0 for estimates obtained in both 40–59 and 60+ years age groups and overall (all age groups combined), indicating significant differences between sex-specific CFRs. CFRs, case fatality rates; HDI, highest density interval; HPD, highest posterior density; SSA, sub-Saharan Africa.
