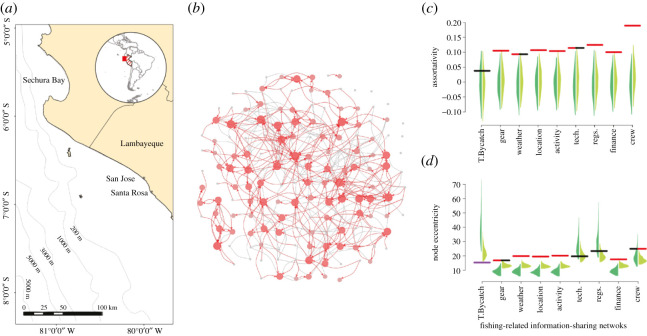
Figure 2.
Structure of information-sharing in relation to sea turtle bycatch. (a) A map of the study site, San Jose, Lambayeque, Peru (6°46' S 79°58' W) and the surrounding coastline. (b) Illustrative network of the structure of information-sharing in relation to sea turtle bycatch. The nodes show each of the fishers surveyed, the adjoining lines show which fisher pairs (dyads) shared information in at least one information-sharing network, and nominations within the sea turtle bycatch network are highlighted as
directed red arrows here (arrows point to the one that was nominated). Node size and shading show the number of nominations each fisher received for sea turtle bycatch information (largest and darkest red = most nominations, small and grey = no nominations). Layout was set as a spring layout of edges across any network (to minimize overlap) and then expanded into a circular setting. See electronic supplementary material, figure S1 for illustrative comparisons of each fishing information type. (c) The observed in-degree assortativity (homophily) in comparison with the null distributions for the different information-sharing networks, and (d) the observed variance in the node eccentricity in comparison with the null distributions for the different information-sharing networks. Horizontal lines show the observed values from the actual networks (red = observed values are above the permutations, black = observed values are within the range of the permutations, purple = observed values are below the permutations). Polygon distributions show those generated by permutations (dark green = outgoing edge permutation that maintains the number of nominations each fisher makes, light green = edge permutation that maintains the number of nominations each fisher makes and also the number of times each individual was nominated). Due to differences in network factors, direct comparisons between the observed values are not informative. For details on each type of fishing information assessed refer to table 1.

