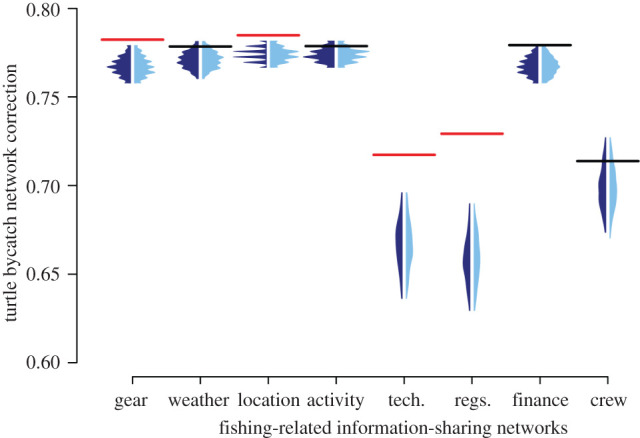
Figure 3.

The observed correlation (and the correlations expected under the null models) between the sea turtle bycatch information-sharing network with all the other information networks. Horizontal lines show the observed values from the actual networks (red = observed values are above the permutations, black = observed values are within the range of the permutations). Polygon distributions show those generated by permutations (dark blue = network swap that maintains the number of nominations each individual makes and also the number of times each individual was nominated, but swaps the network these were made within while maintaining the number of times each network was nominated as overall, light blue = conservative network swap that is the same as dark blue, but also maintains the number of networks each dyad nominated each other for—but changes those networks (same as a gbi permutation but on the dyad-by-network edges). Comparison between networks can be made by comparing the distance between the observed values from the actual networks (horizontal lines) and their associated permutation distribution (polygon) to the distance between the observed and associated permutation for each network. Due to differences in network factors, direct comparisons between the observed values are not informative. For details on each type of fishing information assessed refer to table 1.
