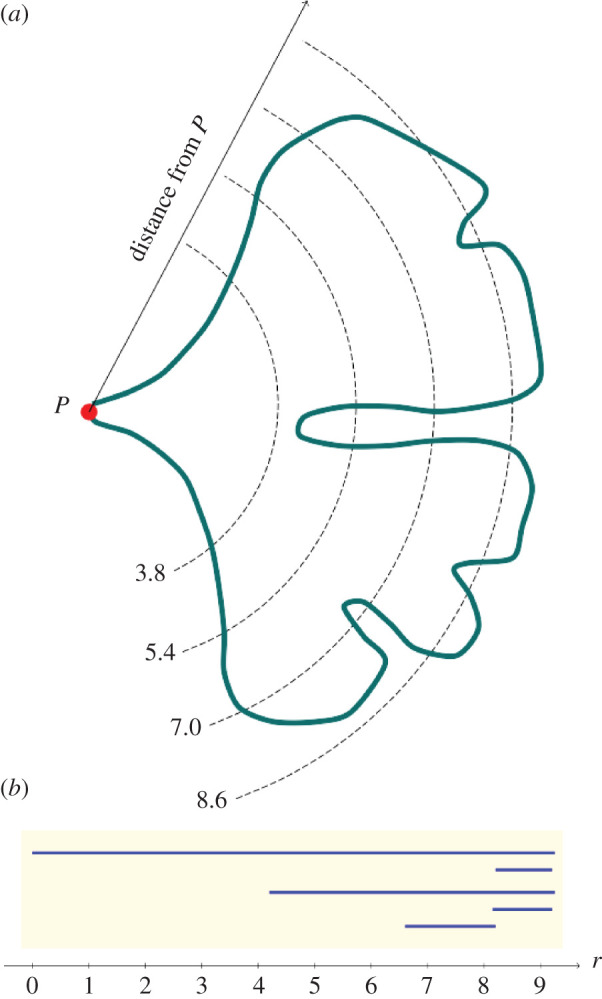
Figure 4.

Schematic example showing the construction of a persistence barcode that describes the shape of a Ginkgo leaf. Four distances from the point P where the leaf blade meets the petiole are shown: r = 8.6, 7.0, 5.4, 3.8 (a). At the distance r = 8.6, there are four connected components outside the dashed line (a). At the distance r = 7.0, there are three connected components, at r = 5.4 there are two (the two lobes of the typical Ginkgo leaf), while at r = 3.8 there is one uninterrupted segment of the leaf blade contour outside the dashed line (a). To construct a barcode that represents a leaf, we do not count the number of connected components at widely spaced intervals as shown in (a). Instead, we perform a count for each r > 0, and record the number of connected components as r is gradually lowered in a barcode (b).
