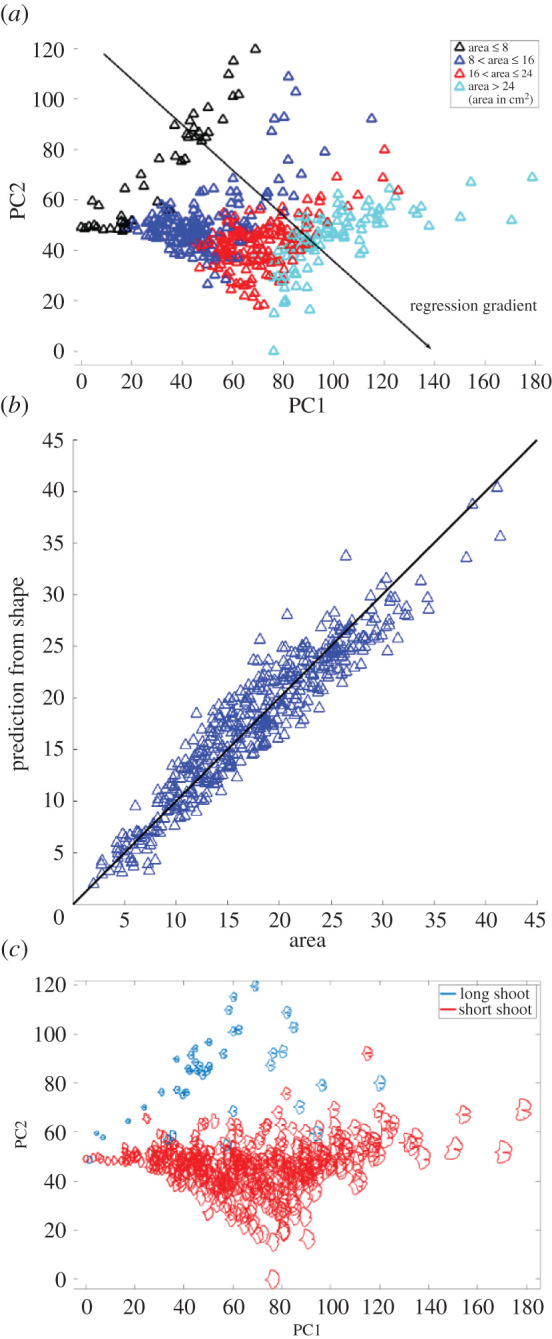
Figure 5.

PCA ordination scatterplot showing the morphological variation among 468 modern Ginkgo leaves that is revealed by our topological (PH) approach to leaf shape, with data points coloured according to four leaf-area groups (a). Comparison of leaf area predicted from the first two principal components and measured leaf area; the vertical offset between data points and the solid black diagonal 1 : 1 line of equality indicates the discrepancy between the predicted and measured areas (b). PCA ordination scatterplot with long-shoot and short-shoot Ginkgo leaves highlighted (c).
